Windows Shell Items Analysis
Deep dive of what we can do with Shell Items on windows

Windows operating systems maintain event logs that capture extensive information about the system, users, activities, and applications. These logs primarily help to inform administrators and users, categorized into five levels: information, warning, error, critical, and success/failure audit. For forensic analysis, event logs are an invaluable resource for reconstructing the sequence of events on a system.
These logs can provide valuable information for forensic investigations, such as:
- Identifying potential security breaches: Security event logs can talk about failed login attempts, unauthorized access attempts, and other potential security threats.
- Tracing activity on the computer: System and application event logs document the activity of programs and processes, offering a timeline of events on the computer.
- Detecting Malware: Malware often leaves traces in event logs by creating new processes or modifying system files. Examining these logs can help identify malware on the system.
- Troubleshooting problems: Event logs can spot hardware or software issues, and help in the identification and resolution of computer problems.
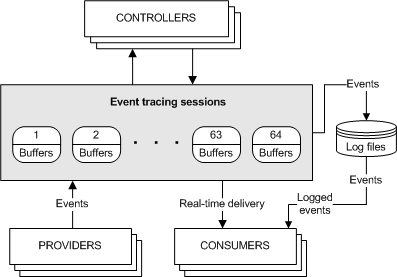
- Windows logging architecture is built on top of what is known as ETW (Event tracing windows).
- If you look at the picture below, you see event providers are typically modules of software, one of their functions is to look at how code is executed and determine whether a success or failure happens or something that should be alerted it then captures bits of information and then puts that into a binary file on your hard drive (that’s a log file)
- ETW which is the foundation for all logging produces two types of log files one is trace logs and the other is event logs that we want to look at.
- One group of those log files ends in an extension (.etl) which is a tracing file, and the other is event logging and produces files that have an extension (.evtx)
- In event logs, they’re in one location: C:\Windows\System32\winevt\Logs
First of all, let’s ask ourselves a question, who generates events?
- Applications
- Windows Operating System
- Services
- Windows Local Security Authority
- Key Management Service
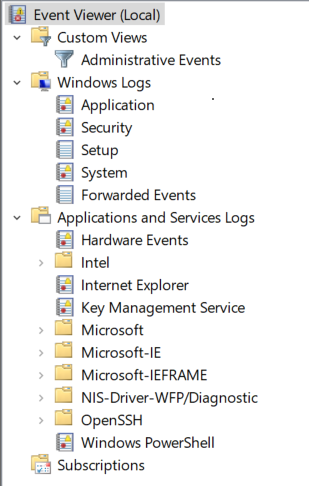
When we look at the general logs under Event Viewer, we’ll see:
- Application log contains events related to the installed applications and services, including errors, warnings, and other significant information about their operation.
- Security log includes events concerning system security, such as user login and logout activities, and incidents related to security threats and breaches:
Security Event Categories:
o Account logon: Events stored on the system which authorized logon (that is, domain controller or local system for non-domain accounts)
o Account management: Account maintenance and modifications.
o Directory Service: Attempted access to Active Directory objects.
o Logon Events: Each instance of logon/logoff on local system.
o Object Access: Access to objects identified in system access control list
o Policy change: change of user rights, audit policies, or trust policies.
o Privilege Use: Each case of an account exercising a user right.
o Process Tracking: Process start, exit, handles, object access, etc.
o System Events: System start and shutdown; actions affecting Security log
- System log records events pertaining to the overall performance and functionality of the system, such as system startup and shutdown events, and issues related to hardware and software.
- Setup: Contains messages generated by installing or upgrading the Windows operating system, if the Windows system is a domain controller, those messages are also logged here.
- Forwarded Events: Administrators can configure Windows event logging for specific applications or services to meet their monitoring needs. (Repository for events retrieved from another system)
Example: when workstation or server becomes a collector and you’re pushing all the events from around your network to one device they will show up under forward events
- Applications and Services Logs: Contains over 60 logs, Useful logs include Task Scheduler, Remote Desktop, Windows Firewall, and Windows Defender
For this show, I will perform two tasks on my computer:
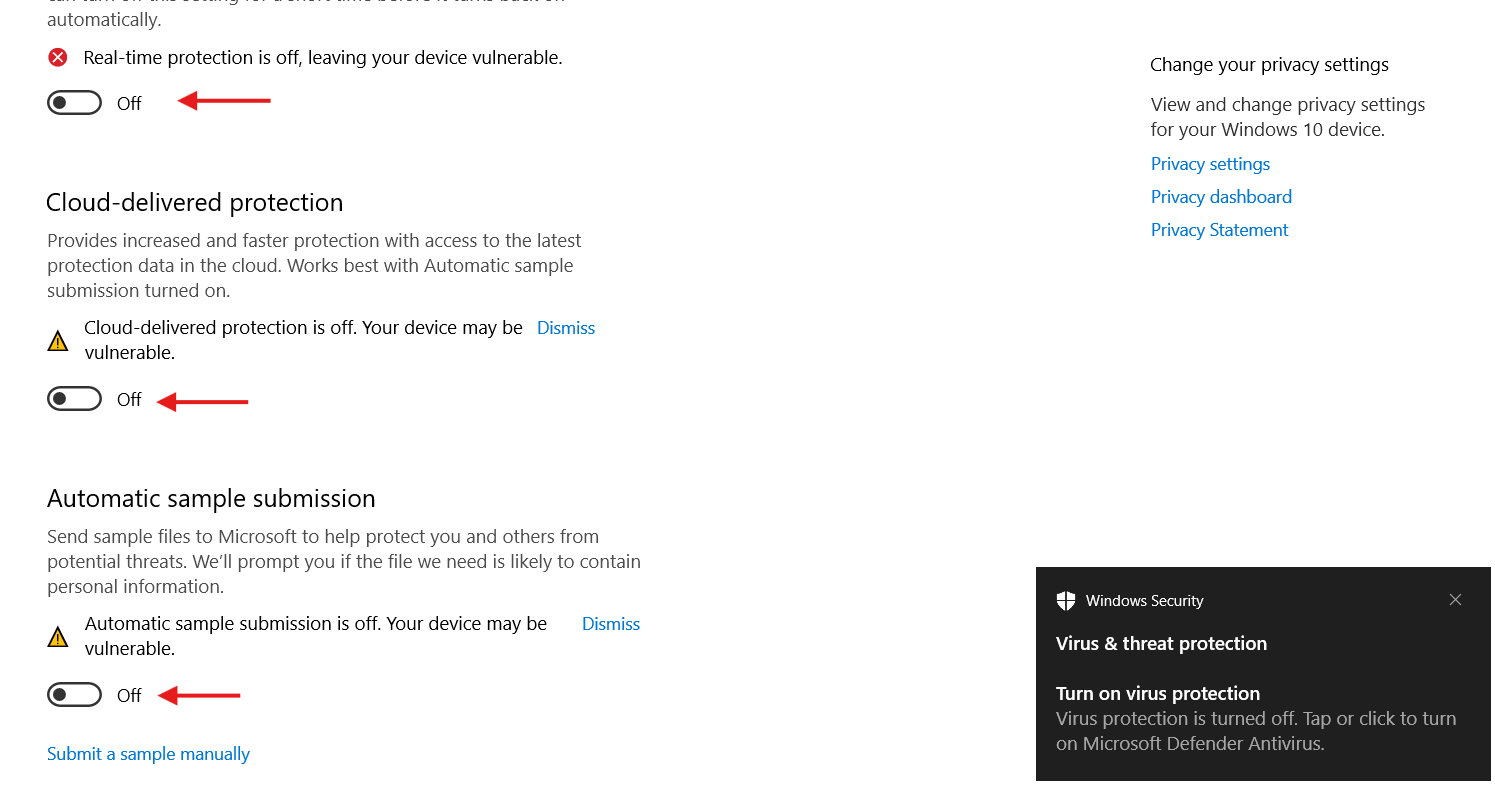
- First, I will disable Windows Defender which is the antivirus software that comes installed on every Windows machine Then we will look at the event logs to review the entries generated by the two tasks finally.
On my computer, first I will disable Windows Defender
Now within the administrator’s PowerShell, I will create a service from a malicious application present on the desktop

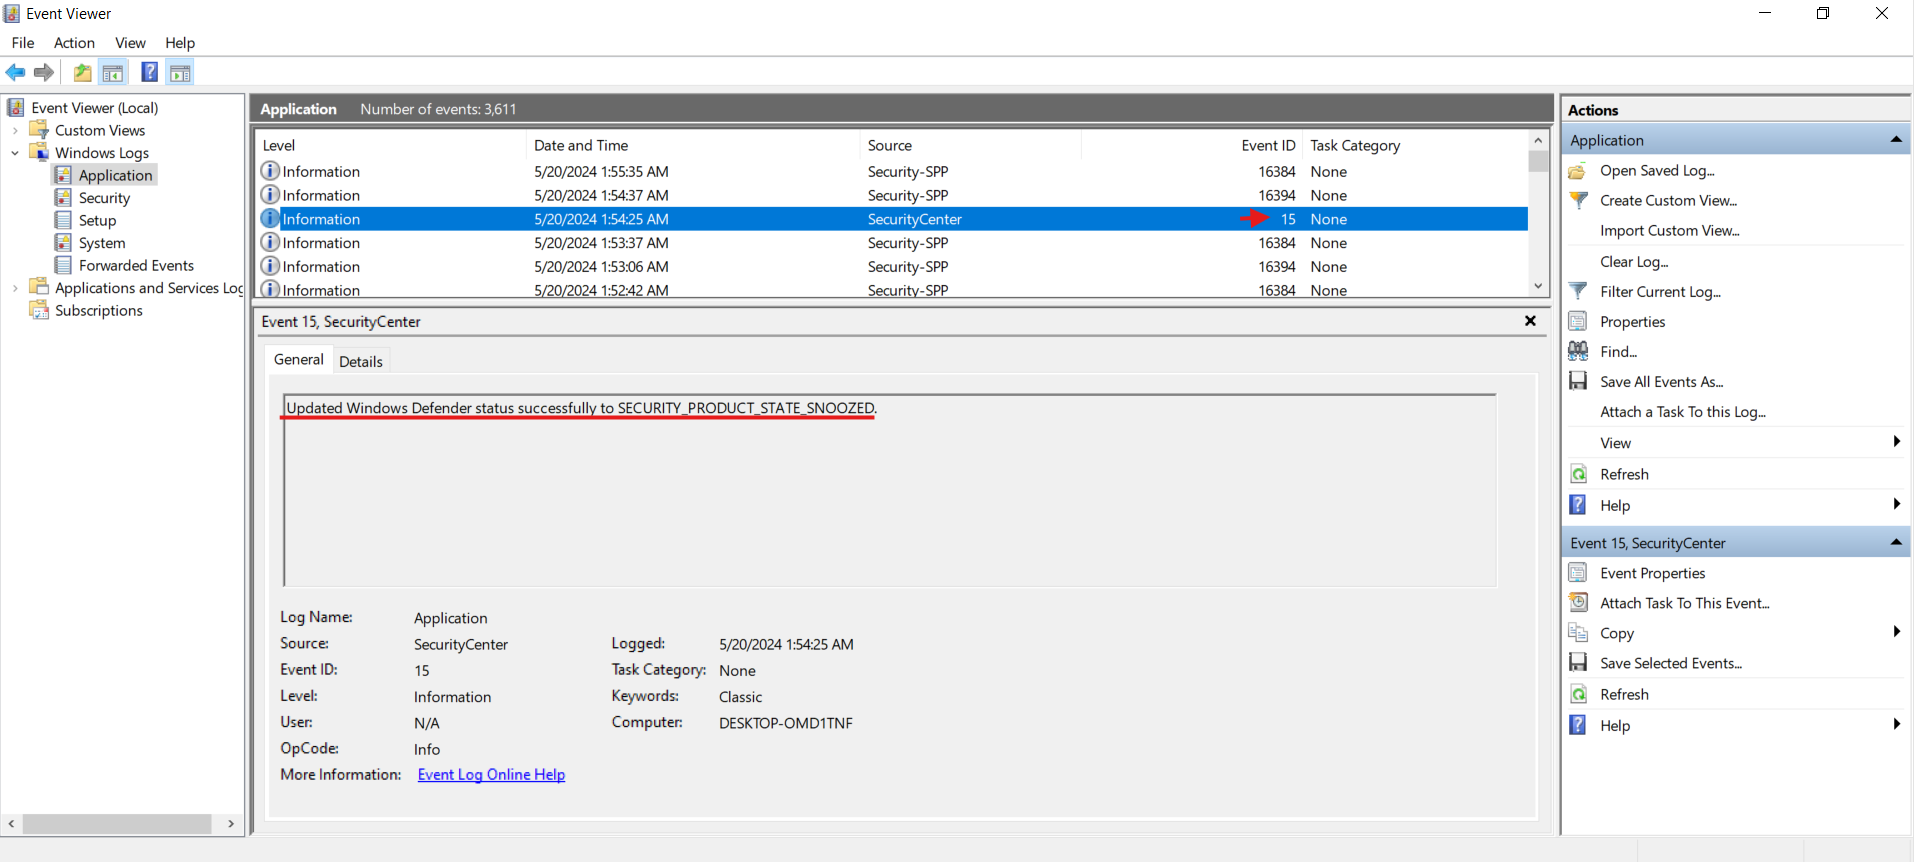
Let’s head over to the event viewer application to view the Windows event logs.
You can see the various categories of event logs here within the application logs we can find an entry that Windows Defender was snoozed along with a timestamp, this indicates that Defender had been temporarily disabled
Within the system logs, we can find an entry indicating the creation of a malicious service along with the timestamp you can also find information about the user that created this service,
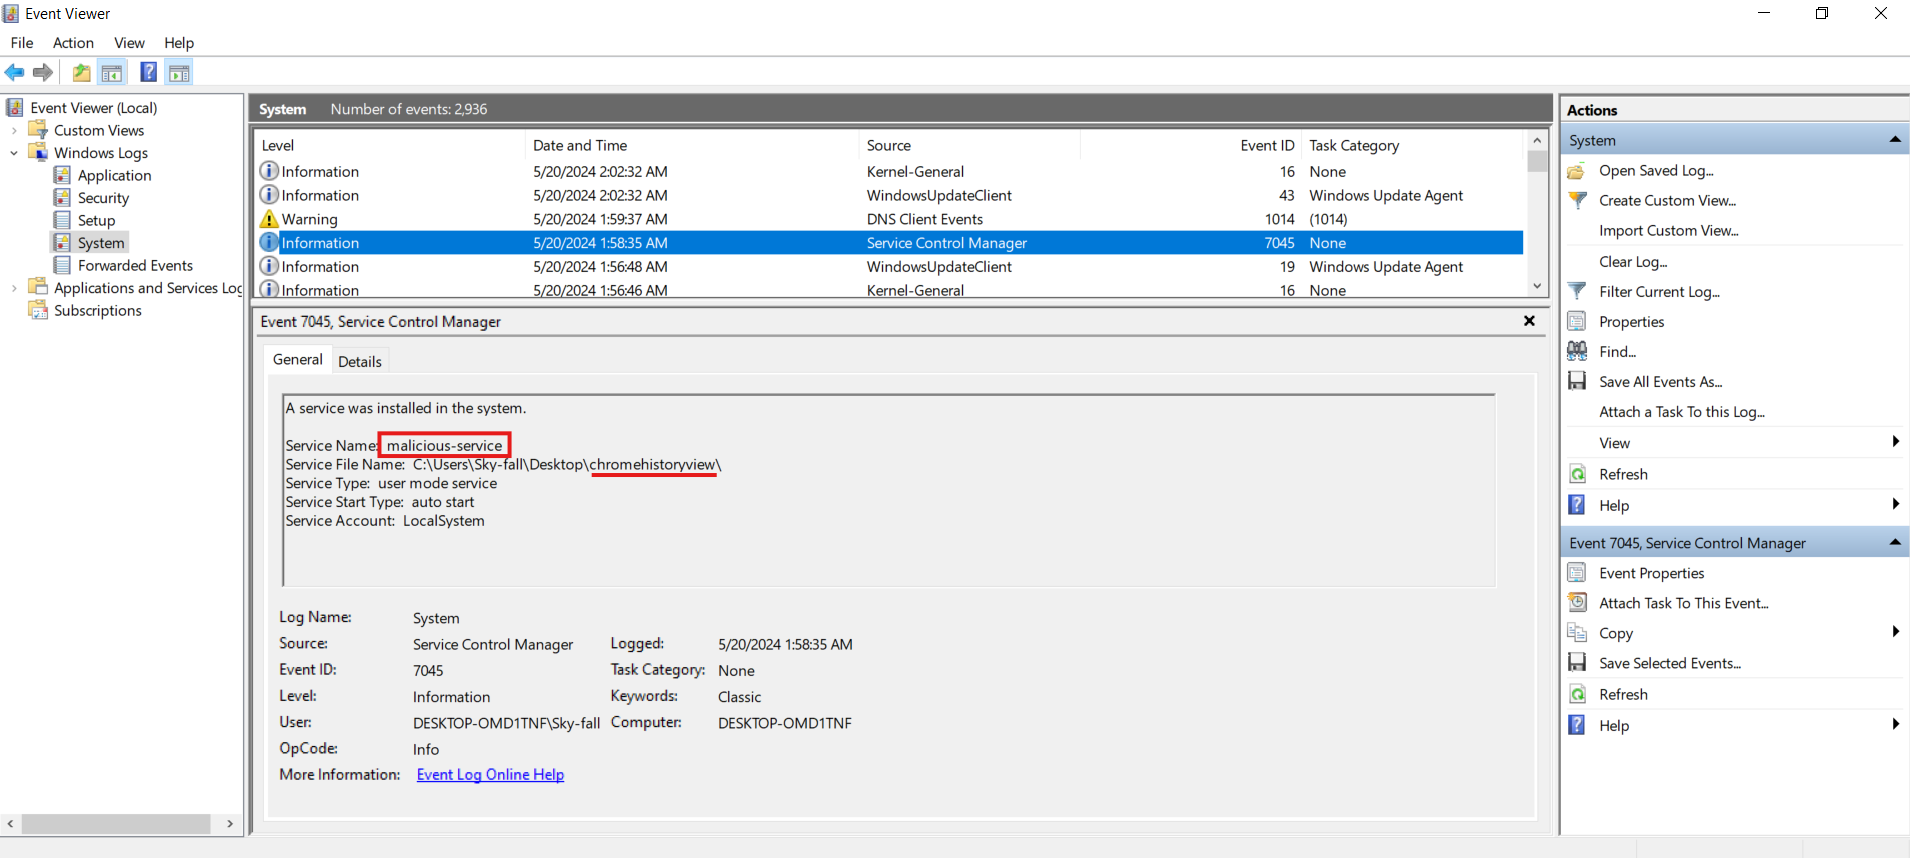
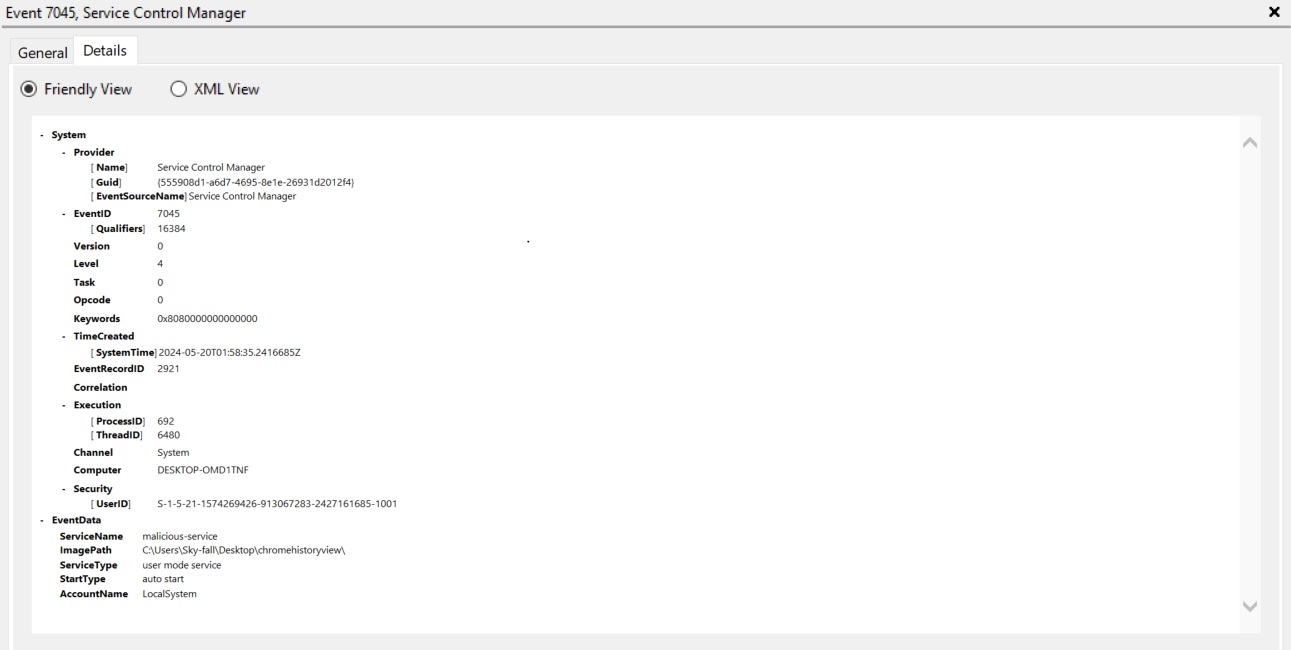
The artifact contains Event Logs in Windows operating systems. The details you can view include:
• Level: Event log level/type. This can be information, warning, error, success/failure audit.
• Channel: Event log channel or category. Security, Application, System, etc.
• Computer: Local system name.
• Event ID: Event identification number. By filtering according to ID we can get the important events.
• Keywords: They are used to group the event with other similar events based on the usage of the events.
• Opcode: The activity or a point within an activity that the application was performing when it raised the event.
• Provider GUID: The unique GUID for the provider. It is useful when performing research or operations on a specific provider.
• Provider Name: Name of event provider.
• Security User ID: It is used to uniquely identify a security principal or security group.
• Task: Identifies the type of recorded event log. Application developers can define custom task categories to provide additional details.
• Event Record Order: Order of the event in the main event category.
• Image path: File offset location of the specific event.
• Event Record ID: Event record identification number in the main category.
• XML: XML view of the event.
• Record Length: Length of the event.
Sysmon is a powerful tool from Microsoft Sysinternals that extends the capabilities of Windows event logging. It provides detailed information about various system activities, which can be crucial for security monitoring, threat detection, and forensic investigations. Here’s how Sysmon can help in enhancing event security logs:
Comprehensive Event Logging
Sysmon generates detailed logs for various system activities that are not covered by standard Windows event logs. This includes: Process Creation (Event ID 1): Logs when a process is created, including command-line arguments, which helps in identifying suspicious processes and command-line activity.
Network Connections (Event ID 3): Logs outbound network connections, including source and destination IP addresses and ports, useful for detecting unusual network activity.
File Creation Time Changed (Event ID 2): Logs when the creation time of a file is changed, which can indicate tampering.
Driver Load (Event ID 6): Logs when a driver is loaded into the kernel, which can detect unauthorized or suspicious drivers.
Advanced Threat Detection:
Sysmon’s detailed logging helps in identifying and analyzing complex and advanced threats. For example:
- Command Line Arguments: Capturing command line arguments used to start processes can reveal malicious scripts and commands.
- Parent-Child Process Relationships: Understanding the hierarchy of processes helps in tracing the origin of suspicious processes.
Behavioral Analysis
Sysmon logs can be used to establish a baseline of normal behavior. Any deviations from this baseline can be flagged for further investigation. For example:
- Unusual Network Connections: Unexpected outbound connections can indicate a compromised system communicating with a command-and-control server.
- Process Activity: Sudden changes in process creation patterns can signal malware execution.
Enhanced Forensics
In the event of a security incident, Sysmon logs provide a rich source of forensic data:
- Detailed Event Information: Logs include detailed information such as hashes of process images, which can help in verifying the integrity of files and identifying malware.
- Timeline Reconstruction: The detailed logs allow security teams to reconstruct the sequence of events leading up to and following a security incident.
Customizable Configuration
Sysmon allows security teams to customize their logging behavior through configuration files. This ensures that only relevant events are logged, reducing noise and focusing on critical activities:
- Include/Exclude Rules: Configurations can include or exclude specific processes, network
Let’s take a look at one of the logs from the Sysmon log source:
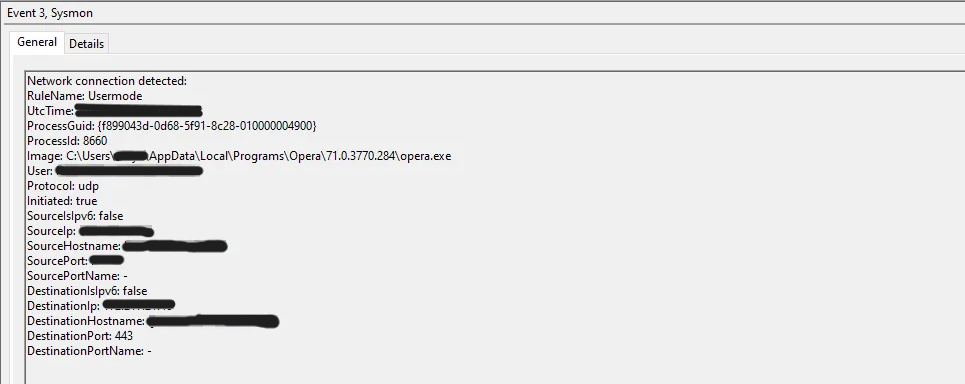
Review the information available with a single log in the bottom pane. This is great stuff! Default logging from Windows isn’t that advanced and Sysmon can easily fill those gaps.
Now we’re going to take a look at a new tool called Chainsaw that provides a powerful first response capability to quickly identify Windows event logs it offers a generic and fast method of searching through event logs or keywords and by identifying threats using built-in detection logic and via support for sigma detection rules
first without any options so you can see the available options and basically what you’re getting here is help being printed out on the screen notice that you can manually invoke help with -h or –halp and that also works for the sub commends you see below so you can get context help any of those sub-commends speaking of those sub-commends we’re going to be primarily focused on the search and hunt now the search will allow you to search through event logs for a specific event.
we have the hunt functionality which is pretty cool this will use either built-in logic or those sigma detection rules we talked about to find things that may be anomalistic or potentially evil.
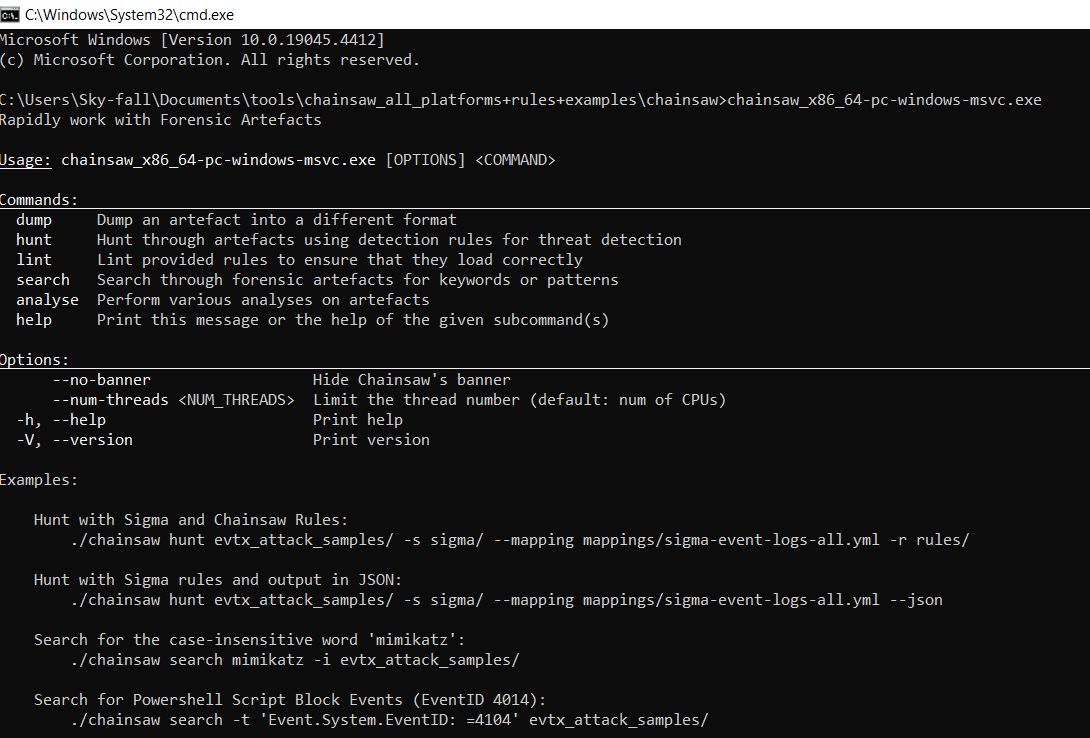
So, let’s go ahead and run it with our simple search option.

In this case, I’m going to type search and specify the path to those event logs, AND THEN I’m GOING TO USE -e FOR EVENT ID AND I’LL SPECIFY 21 WHICH IS ONE OF THE EVENT IDS USED WITH RDP RELATED EVENTS
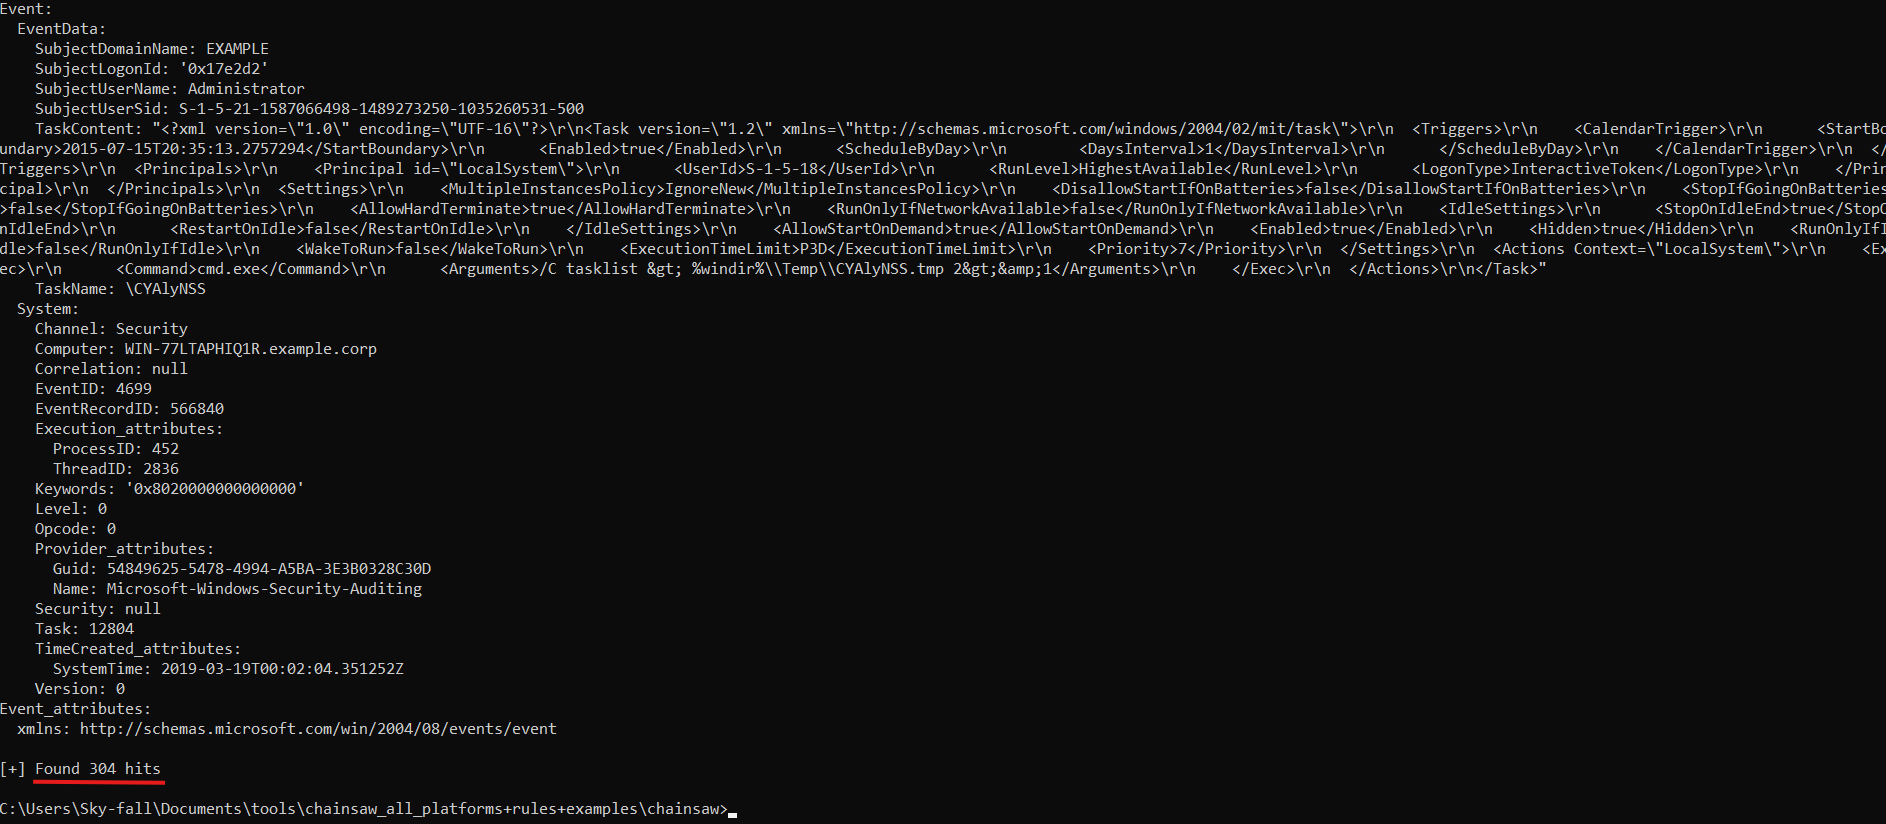
So, check that out found 304 evtx files matching entries and if we go up to the start of the last event you’ll notice it looks just like this and as we scroll up we’ll see more, and more of those event stanzas, but here you see channel computer, event id, stander name of event log you can also notice the system time and event happened, so that’s a very simple use case and is quite powerful when you’re searching through quite a few event logs
Now, an interesting part of Chainsaw and that’s using the hunt sub-command.
We need to specify the hunt sub-command and then the path to the directory or to a single file that we would like the tool to parse and what about Sigma rules!
Let’s about using those, so to do that we need two parameters the first is –rule or -r and we’ll specify the directory where those rules live which is sigma.
And then –mapping or -m and then we point to this mapping file you see below, the sigma-mapping.yml
 After execution, you should see an output that shows you how many rules are being used in this case 278 detection rules. and if we look in the table below we can see
 event id: 1116 that points to Microsoft Defender Antivirus detected malware or other potentially unwanted software.
And event id: 1117 points to Microsoft Defender Antivirus taking action to protect this machine from malware or other potentially unwanted software.
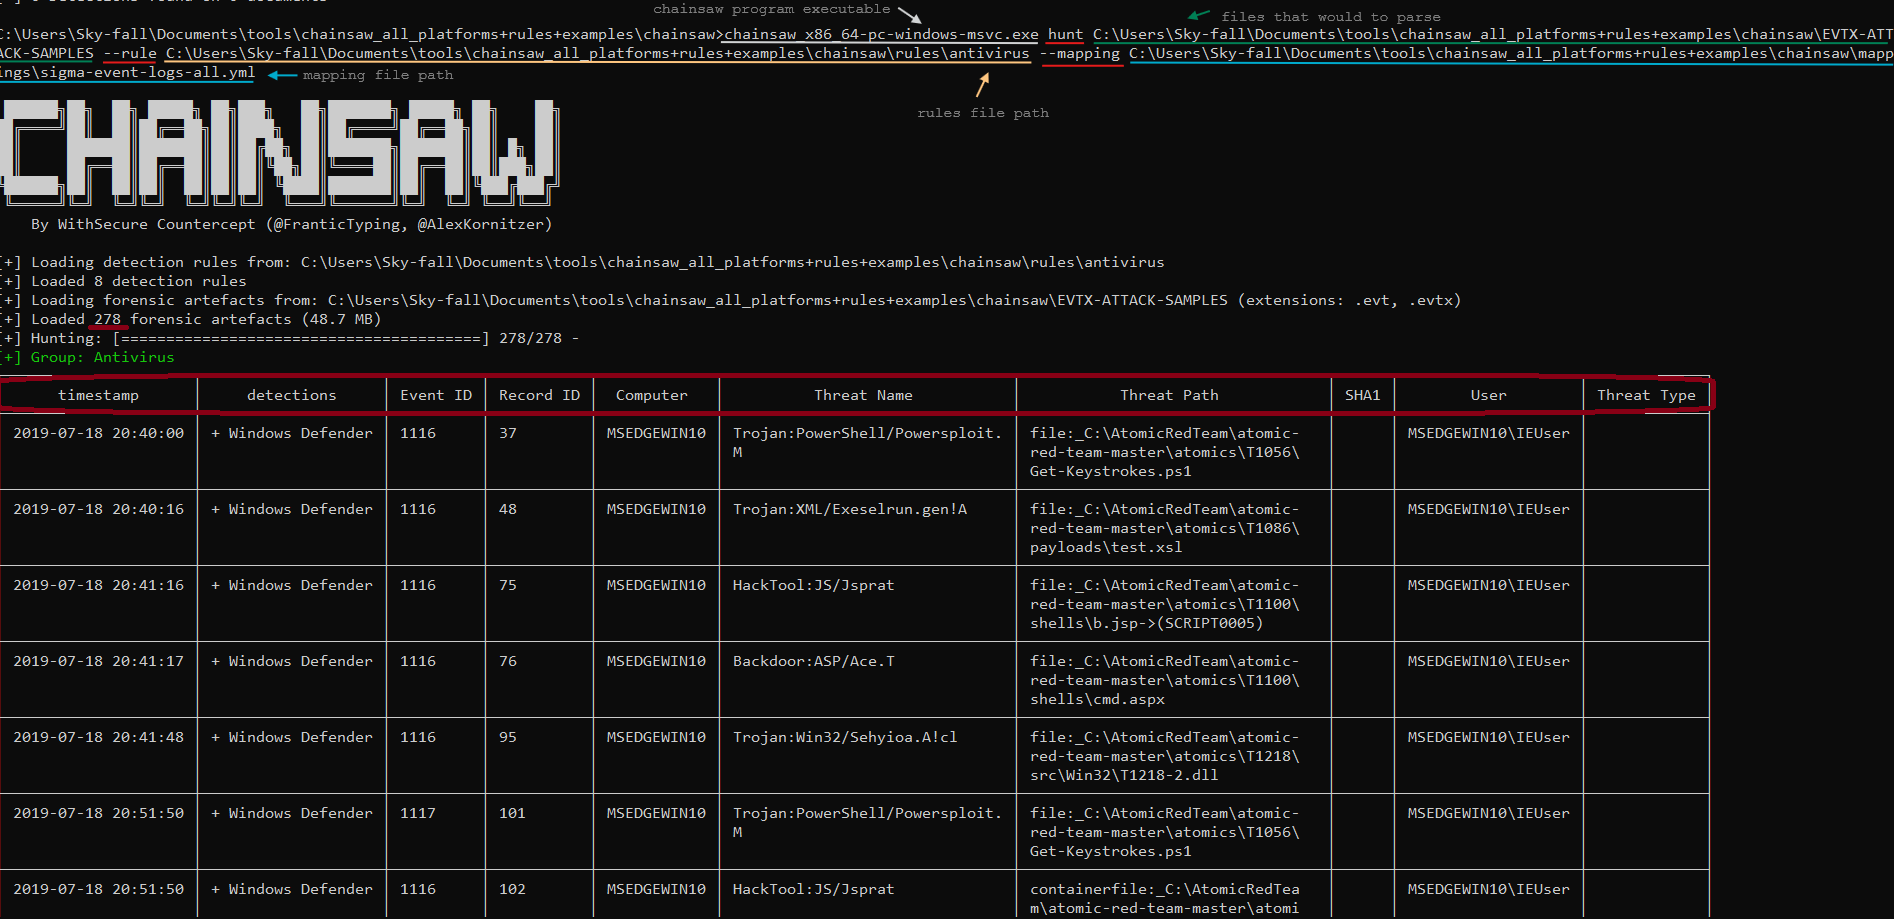
If you continue to look you would have a lot of additional information about processes that may warrant further inspection so a lot of additional stuff is being shown based on those sigma rules. If you look at the BOTTOM, we now have 11 DETECTIONS

Now one last thing I want to show you is using the CSV output option since there was much information on the screen here if we use –CSV and –output with the path we need to extract it.

And there we go, we have our csv file in this case we have 11 lines of events that we want to look into and suspicious program locations.

All kinds of things here so again quite a bit of interesting information and probably the csv option is something you’re going to want to use if you are indeed using the hunt option because that way you have all the data written to files.