

How SIEM Works
Understanding how SIEM Works


Network forensics is a specialized field within cybersecurity focused on the monitoring, capturing, and analysis of network traffic to uncover and investigate security incidents or breaches.
By examining data packets, network logs, and communication patterns, network forensics aims to reconstruct events leading up to an incident, and understand their methods. This process is crucial for not only resolving current security issues but also for strengthening defenses against future attacks.
With cyber threats becoming increasingly sophisticated, network forensics plays a vital role in safeguarding digital infrastructures and ensuring overall network security.
To identify attacks, investigators must have a good understanding of how different parts of a network communicate, such as websites, emails, general network communications, and file transfers.
Serious cyberattacks, like ransomware or attacks on supply chains, usually start with someone getting into the target system without permission. After that, they move around inside the network, this happens through multiple network devices like routers, firewalls, and switches.
Wireshark is a powerful tool for examining network traffic, commonly used in digital investigations. By installing Wireshark on a portable drive, Investigators can perform real-time forensic analysis, which helps in responding to incidents and focusing on important tasks first.
This tool enables investigators to quickly understand the current situation, stop the attack, and collect evidence and information to avoid similar incidents in the future.
Wireshark is a free and open-source network protocol and traffic analyzer that enables users to capture and troubleshoot network traffic.
Essentially, Wireshark allows you to capture traffic on a network and presents the captured traffic as individual packets for detailed analysis. It captures packets on a network, displaying various packet fields and headers based on the type of packet selected.
When capturing traffic, you do so through an interface, which Wireshark calls a network interface card (NIC). This could be a wired or a wireless connection. The amount of data you capture depends on your interface.
For example, if you’re using a wireless adapter that doesn’t support monitor mode (which allows you to capture traffic from other devices on a wireless network), you won’t be able to capture that traffic. So, the type of device you use affects your ability to capture different types of network traffic.
Let’s work on an example exercise. We need to examine harmful network traffic, and the pcap file we use will have data that’s either sent over HTTPS or HTTP but protected by a TLS certificate. Our job is to decrypt this data and figure out what kind of harmful software was used to attack a computer on the network.
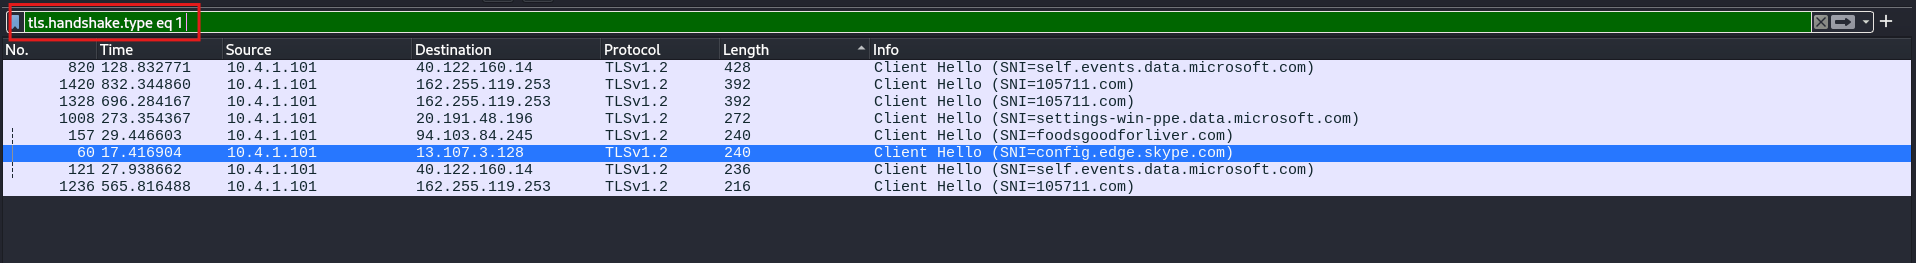
As a digital forensics’ investigator, you may need to examine a pcap file to find out if a device was infected and what happened. In these situations, you can use the helpful filtering tool in Wireshark. For example, you can filter for successful TLS handshakes by using tls.handshake.type == 1. This example shows the use of TLS protocol version 1.2.
You can tell that this traffic is encrypted because it has an SSL certificate. By following the TCP stream.
To follow a TCP request in Wireshark:
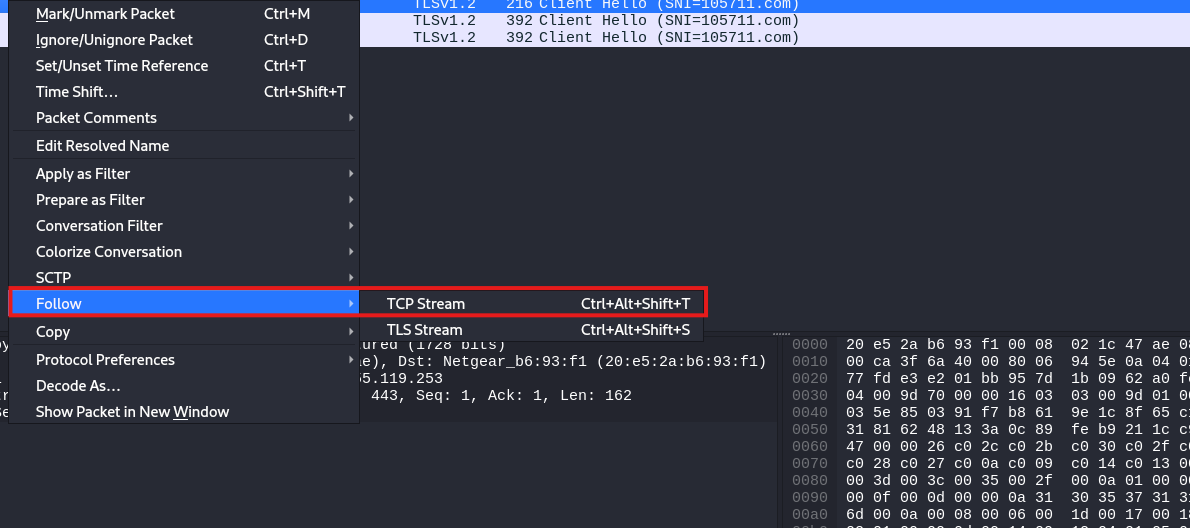
You’ll notice that all the data remains encrypted.
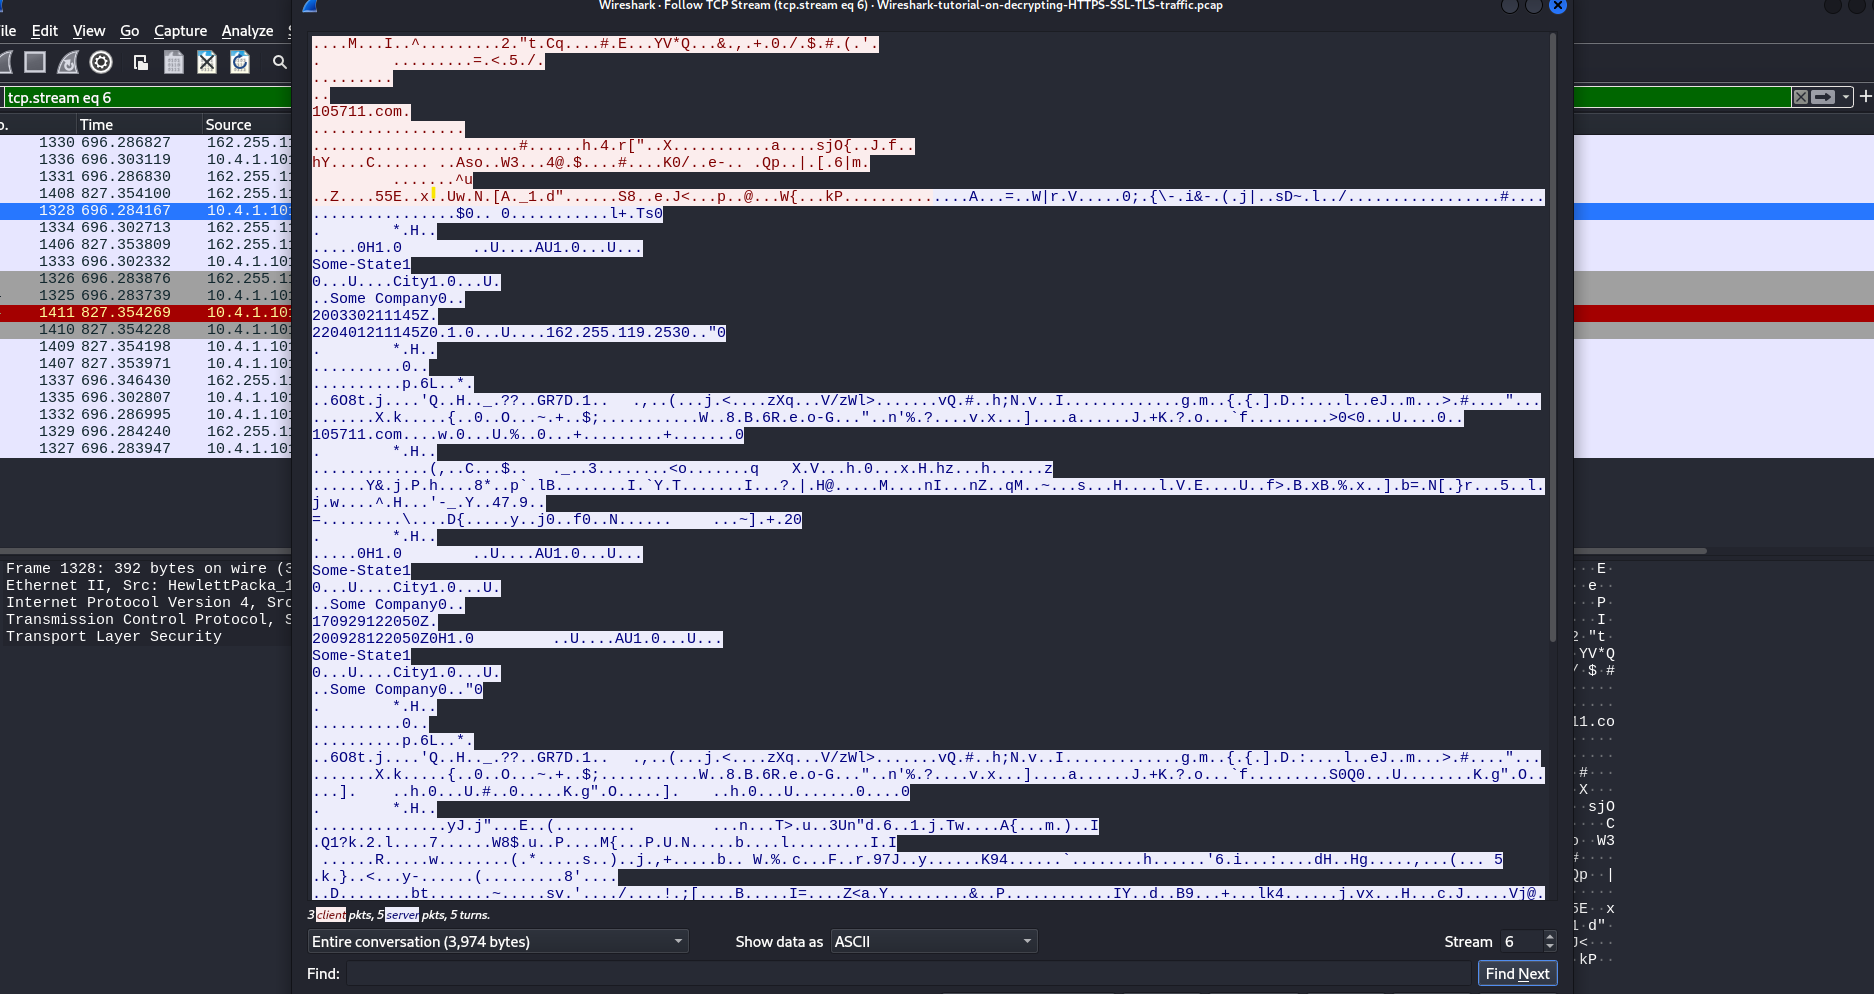
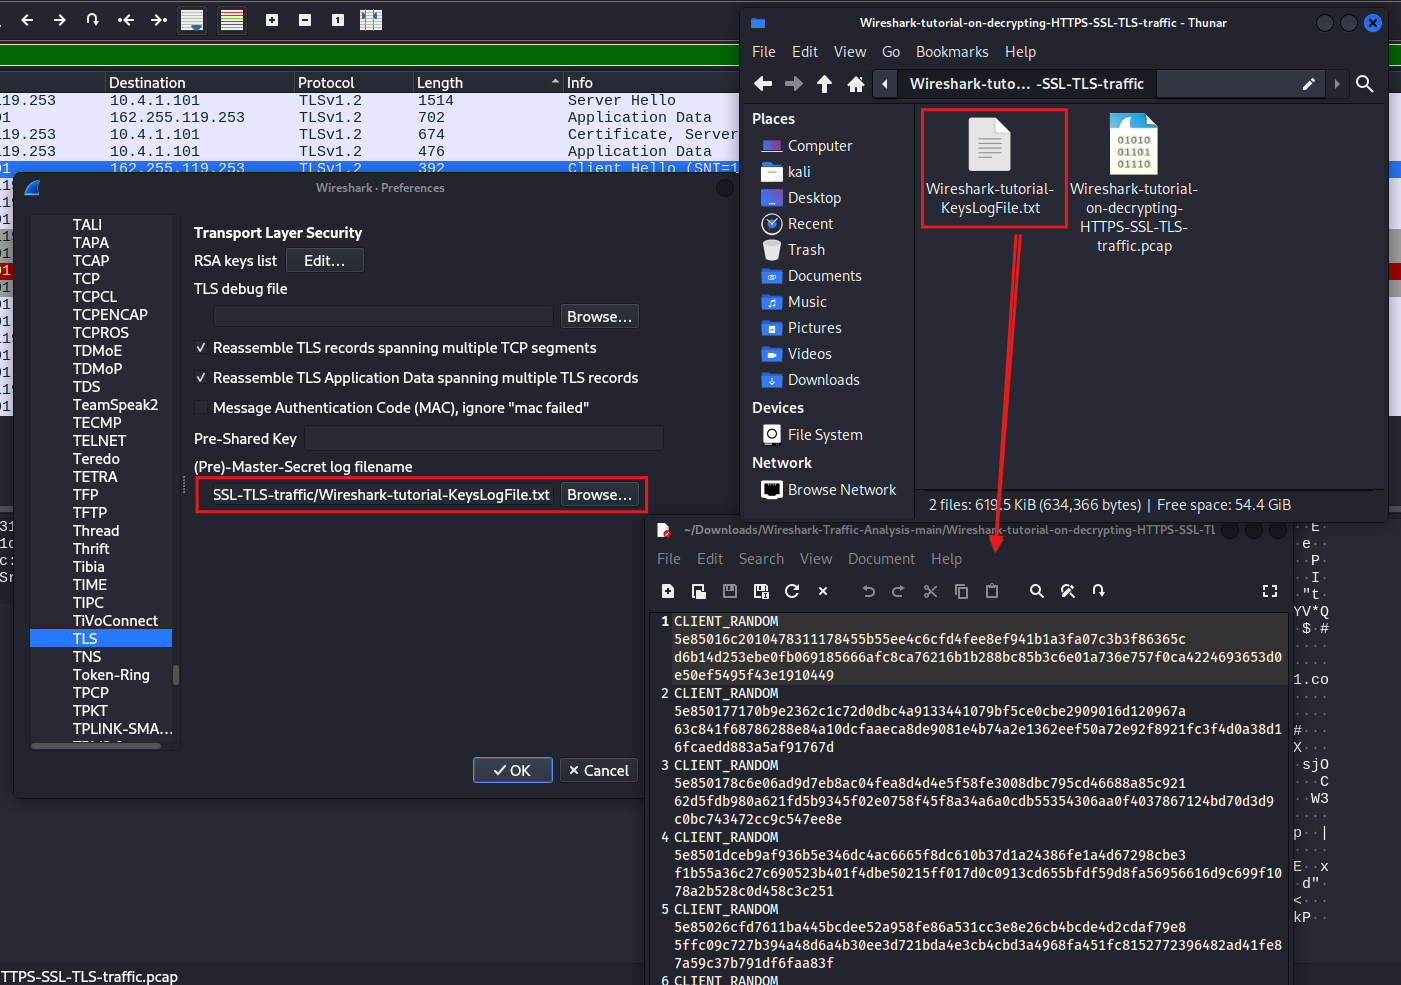
It gives you the real SSL keys needed to decrypt HTTPS or SSL encrypted data. Now that we have these keys, how do we use them to unlock the data?
To do this, click on Edit, then choose Preferences. Look for Protocols and find TLS. You’ll find a spot for the Pre-Master Secret log file name. Go to where you saved the file, pick the Wireshark tutorial keys log file, and press Open
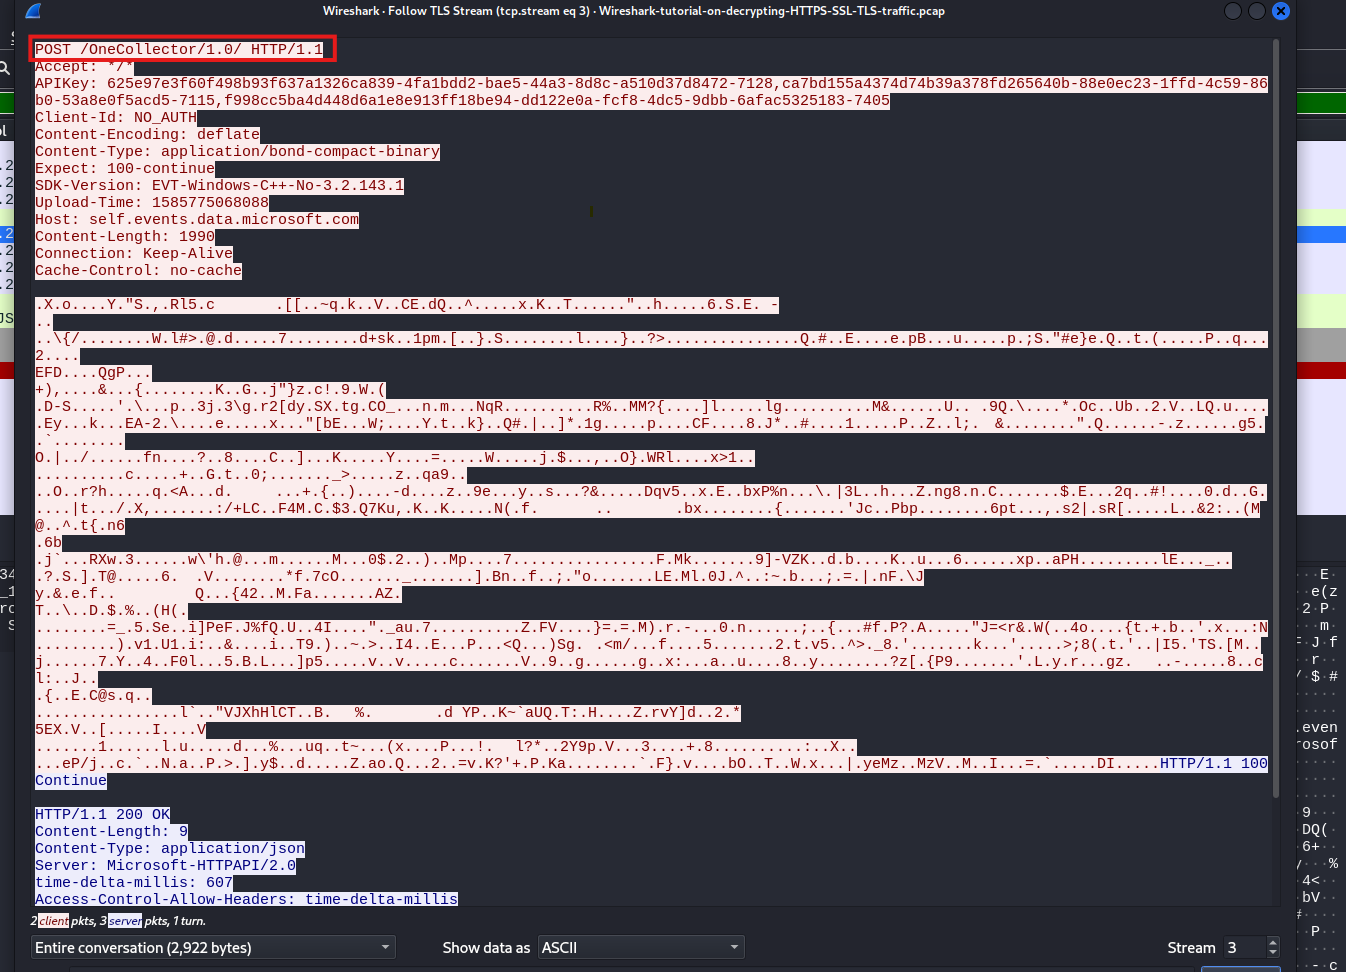
When we use a filter to look at the TLS handshake by typing “tls.handshake.type == 1” and press enter, we can then follow the TCP stream to see the communication. By examining the TLS stream, we can see the actual POST requests being made, which lets us analyze the data that is being sent
Now, our goal is to determine which system was affected and what type of malware led to the infection.
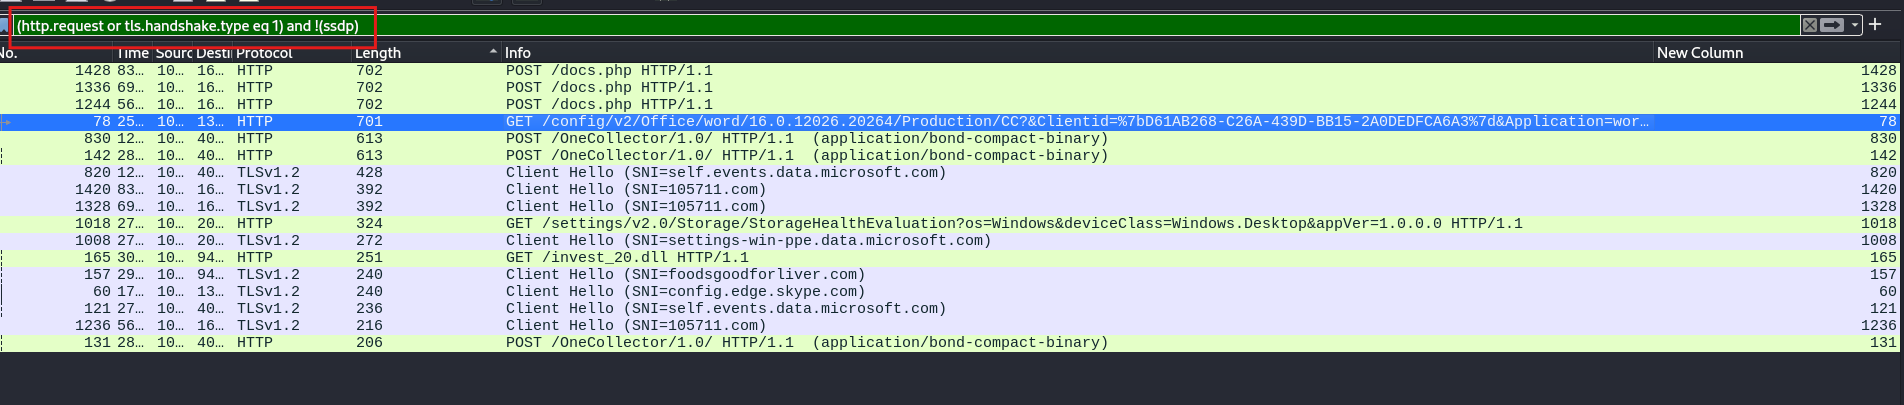
We’ll use a filter in Wireshark. First, we’ll set the filter to http.request, and then we’ll use logical operators.
We’ll set the filter to http.request or tls.handshake.type equal to 1 (which is the filter we used previously), and then we’ll exclude the SSDP protocol.
So, our full filter will look like this: (http.request or tls.handshake.type == 1) and !(ssdp). Once we’ve set this up correctly, we’ll press enter to show all the HTTP requests or secure communications, but we won’t show any SSDP messages.
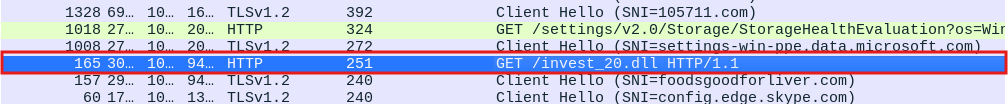
We have a GET request, and by clicking on it, we see that it’s requesting or downloading a specific resource called invest20.ell
By right-clicking on the packet and selecting Follow HTTP Stream, we can observe what happened. We see that the source IP on the network made a GET request to a specific server for the DLL. The server responded with an OK, indicating that the file was found, and then provided the octet stream containing the DLL.
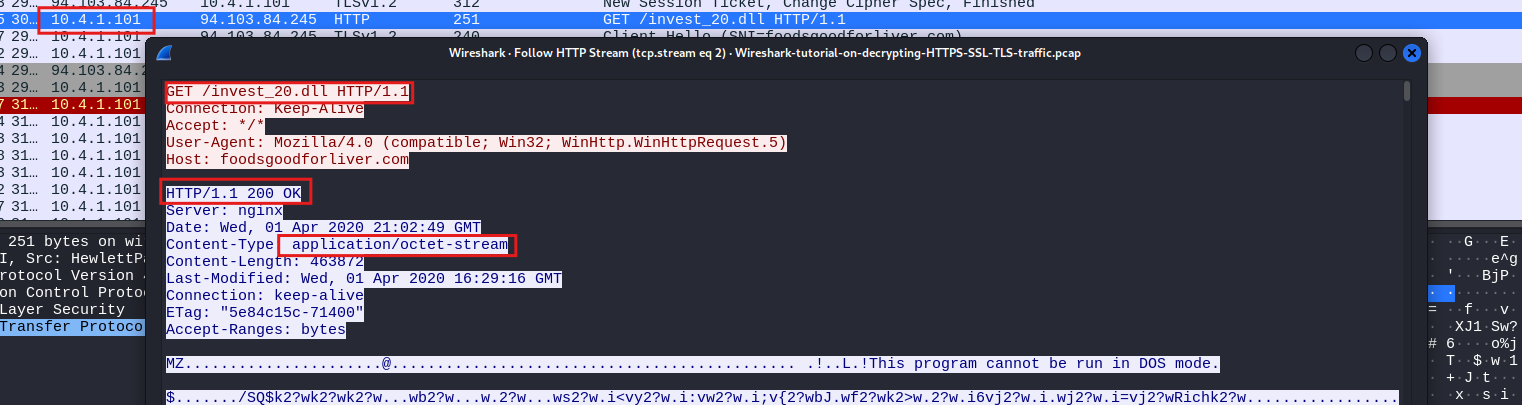
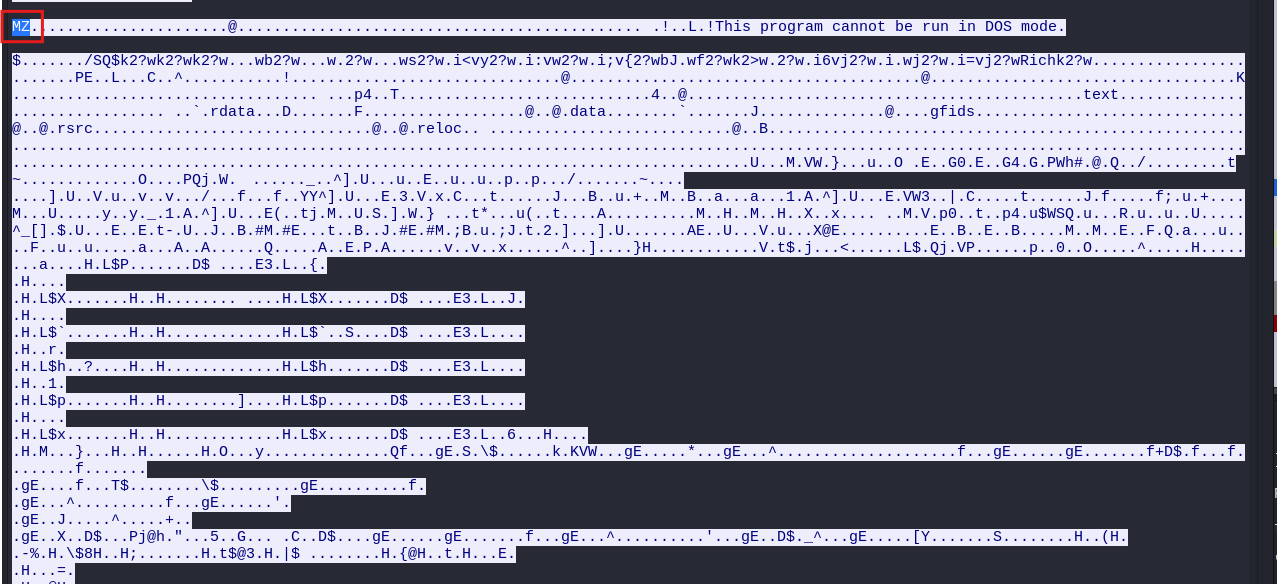
The application data contained within that packet appears to be the actual DLL. We can confirm this because we see the DOS stub, which includes the message “This program cannot be run in DOS mode.” This indicates that the content of the packet is indeed the DLL file.
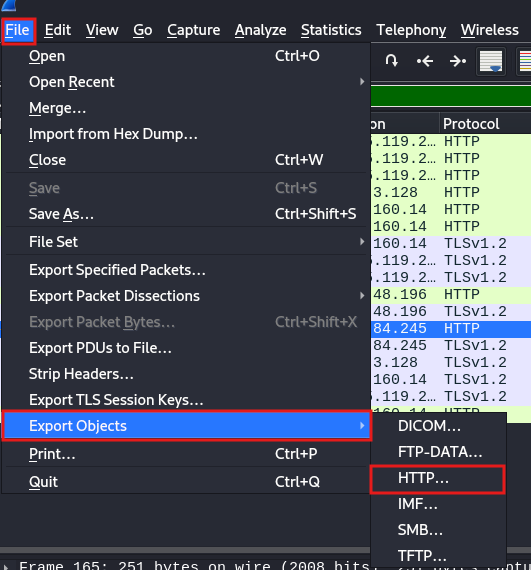
As a malware analyst or threat hunter, you would need to download or save the content of this DLL file to analyze it with a tool like VirusTotal. you can save the DLL as a file because it’s no longer encrypted. Follow these steps:
1- Find the correct data packet in Wireshark.
2- Click on that packet and choose the Export Objects to save it as an HTTP file
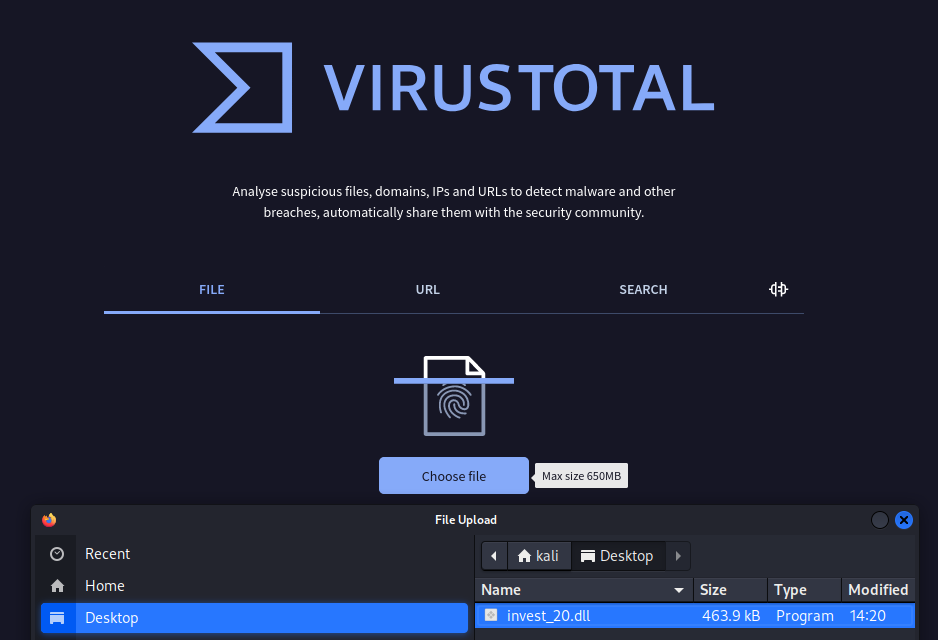
We are looking for the file named invest_20.dll. To save this file, choose to export it and save it on your desktop as invest20.dll. This will allow you to save the downloaded file for further analysis.
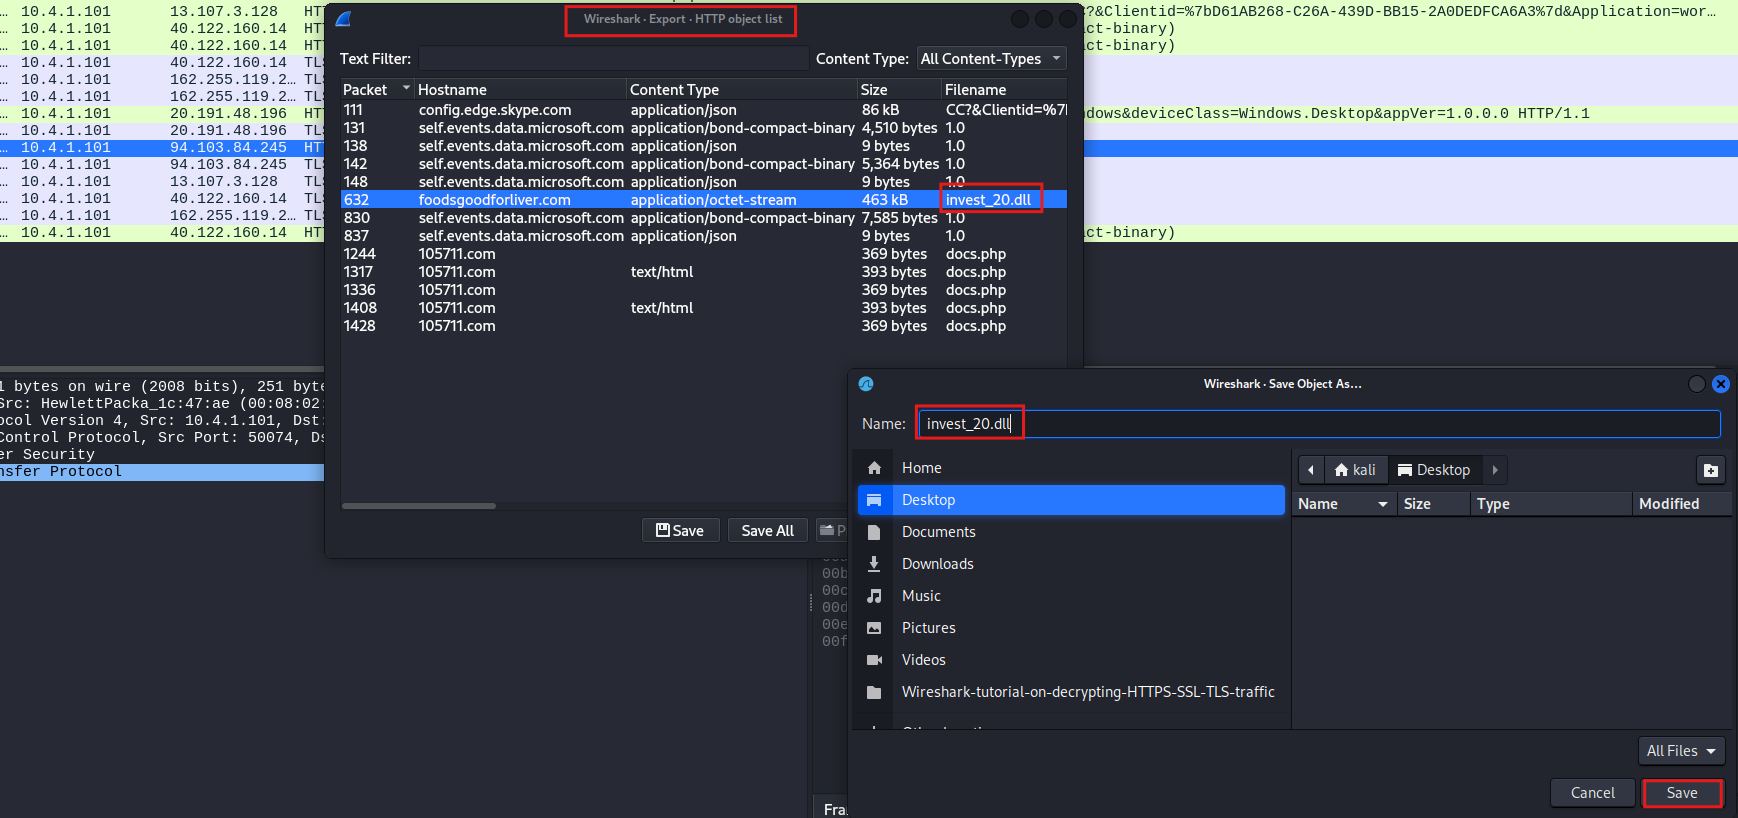
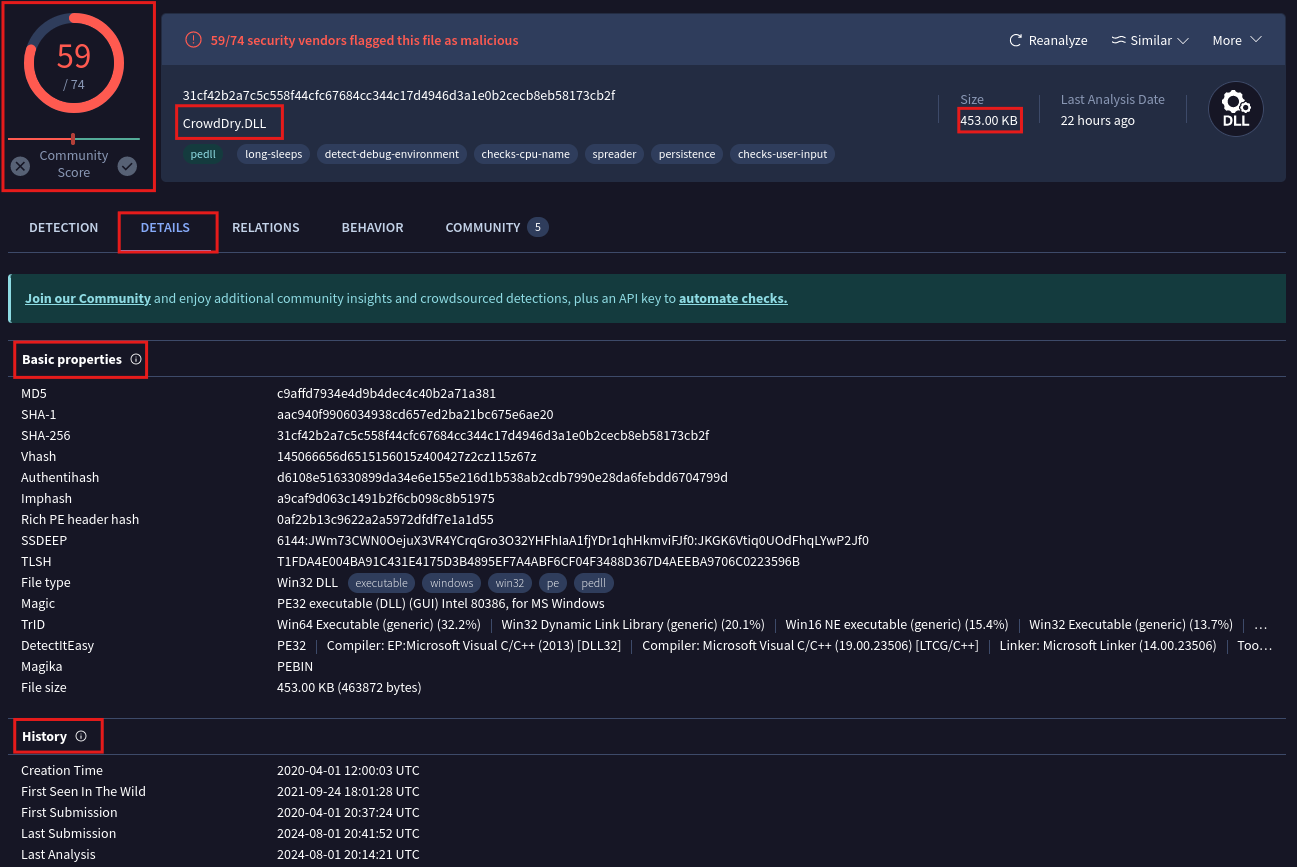
Once the file is saved, you can use a service like VirusTotal to identify the type of malware. Simply upload the malware file to VirusTotal for analysis.
You’ll see that this is flagged as malware, with the original DLL being crowddrive.dll. You can learn more details about it here, including the fact that it’s a Win32 DLL Portable Executable. Additionally, you can find information about when this specific piece of malware was created.
You can see that the execution parent is an Office Open XML document, typically with filenames like investments.doc. By clicking on it, you can explore the relationships. The number of these relationships gives you an idea of the infection type and its cause. This method helps you understand the infection vector and how the malware was introduced.
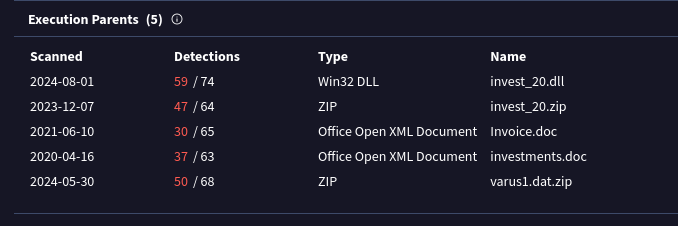
In this case, it seems that someone on the network received the file through email and downloaded it. They opened the Excel file using Excel and ran the macro inside it. This macro caused more code to run, which downloaded a file called a DLL. This DLL file then caused the computer to become infected
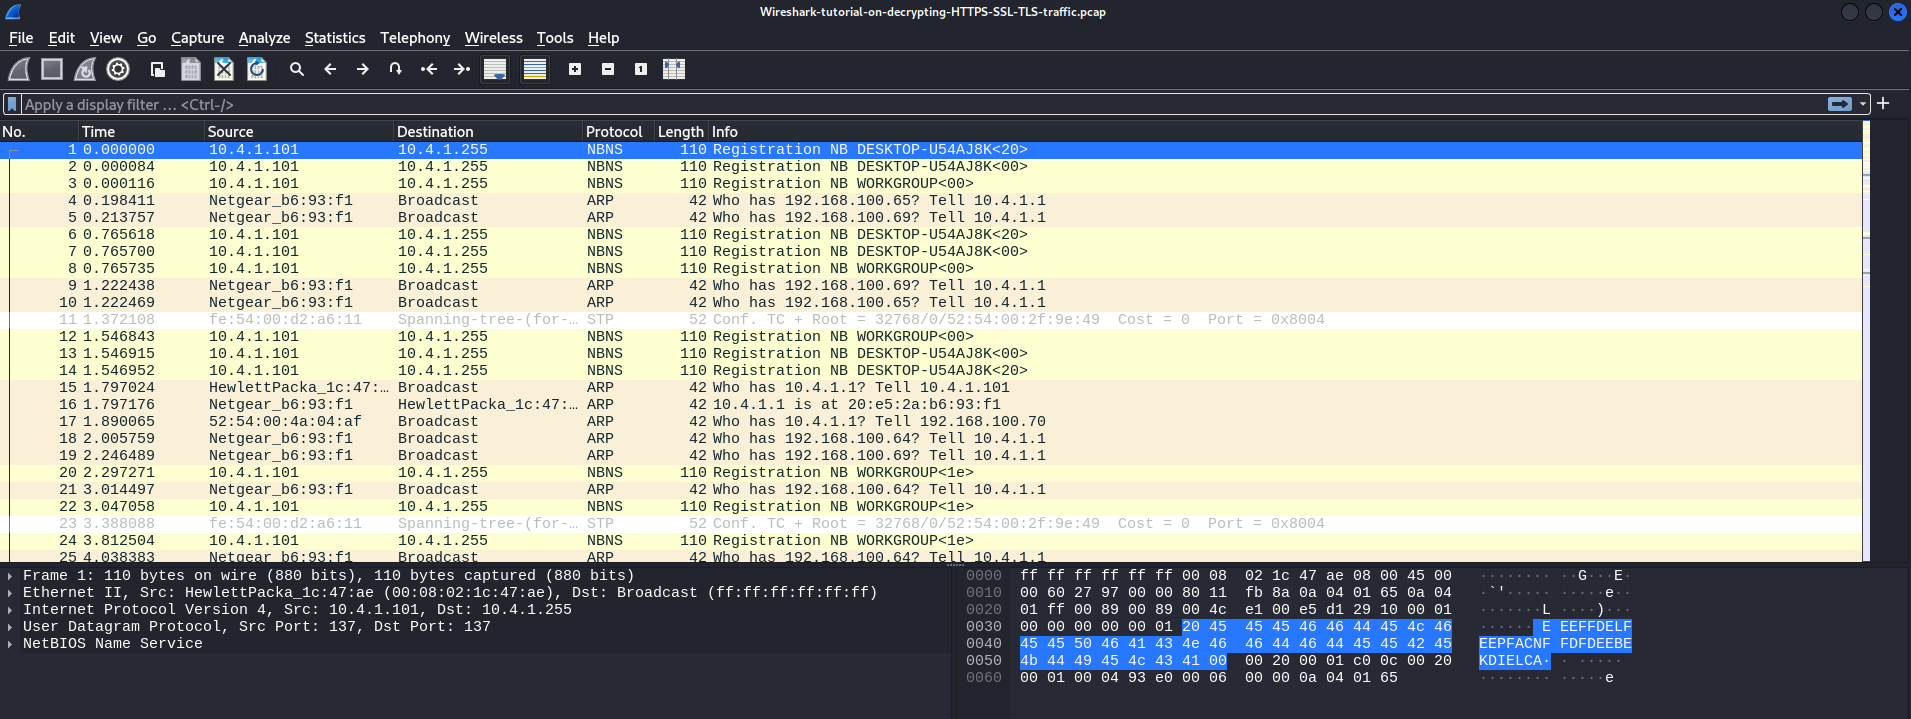
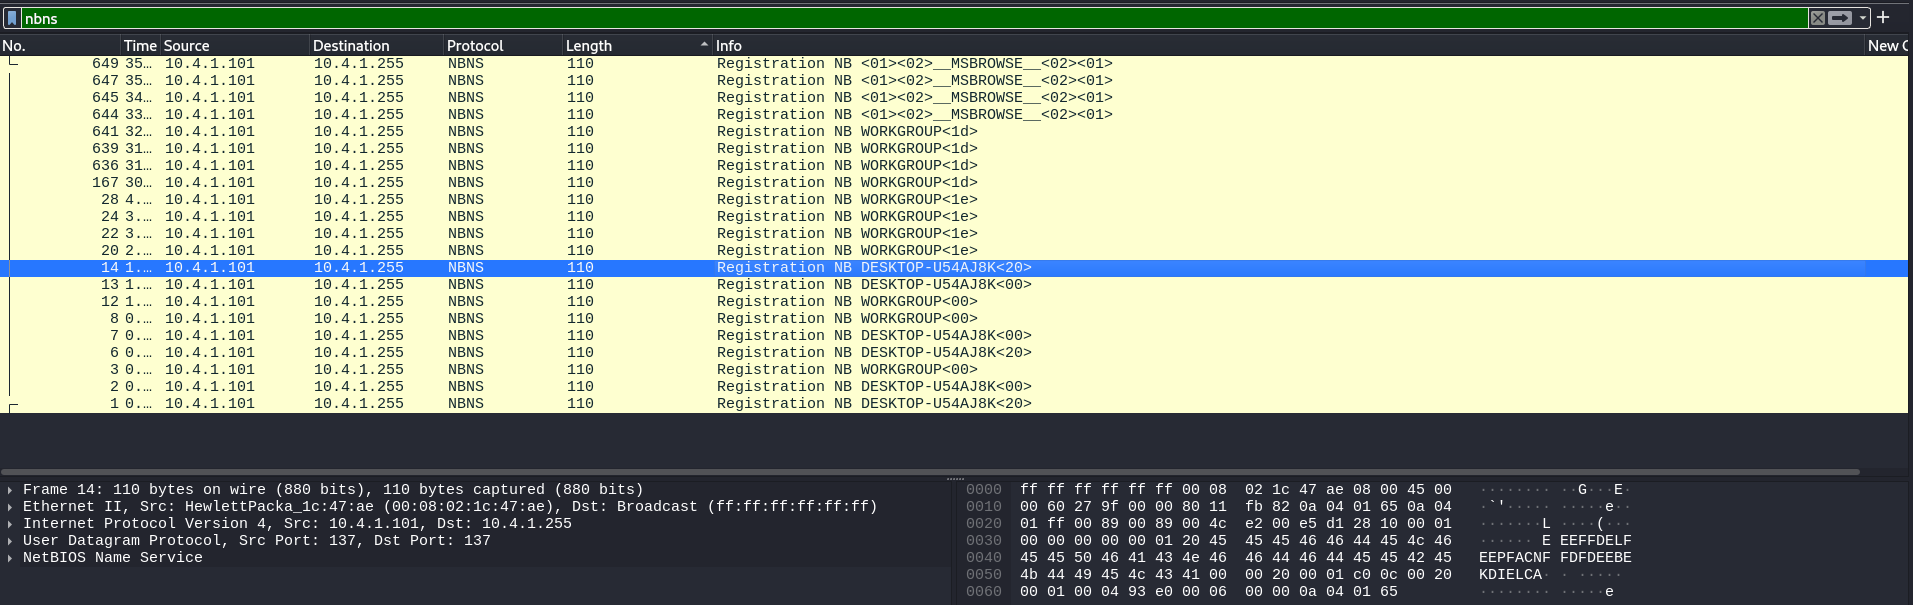
By filtering for NBNS and hitting enter, you can see that the host’s name is DESKTOP-U54AJ8K.
Resources:
https://github.com/AlexisAhmed/Wireshark-Traffic-Analysis
Author: Asem Ashraf


Understanding how SIEM Works