Objectives
In this blog post, we are going to focus on making our lives as DFIR analysts easier when dealing with browsers that keep records of almost everything that happens on them.
We are going to catch the following traces (each one will be explained briefly in its section):
- local state
- History
- Cache
- Login Data
- Cookies
- Extensions
- Form Values
- Downloaded files
- Search field
Introduction
Browsers have become a crucial part of our electronic life as they are used everywhere and on all devices (mobiles, tablets, computers, embedded devices…etc).
also, a lot of applications are web applications which means it’s not a browser with full functionalities but it’s built on top of a browser code which also means that its investigation is the same as browser investigation one of the most important applications used is “Windows mail”.
Important to note also that browsers are a very serious attack vector as it’s the source of a lot of compromises by tricking users into downloading malware or visiting a compromised site or even a browser exploitation.
a lot of browsers use Chromium as a base code and the most known browsers doing that are:
- Google Chrome
- Microsoft Edge
- Brave
- Opera
Experience Level required Beginner
OverView
we are going to practice on “Google Chrome” you can find the practice content we are using for this blog post in the References section.
In a typical Windows machine, you can find the Chrome folder in the following path “Users\%Username%\AppData\Local\Google\Chrome\User Data"
Here is a mind map for some important files and folders and their content.
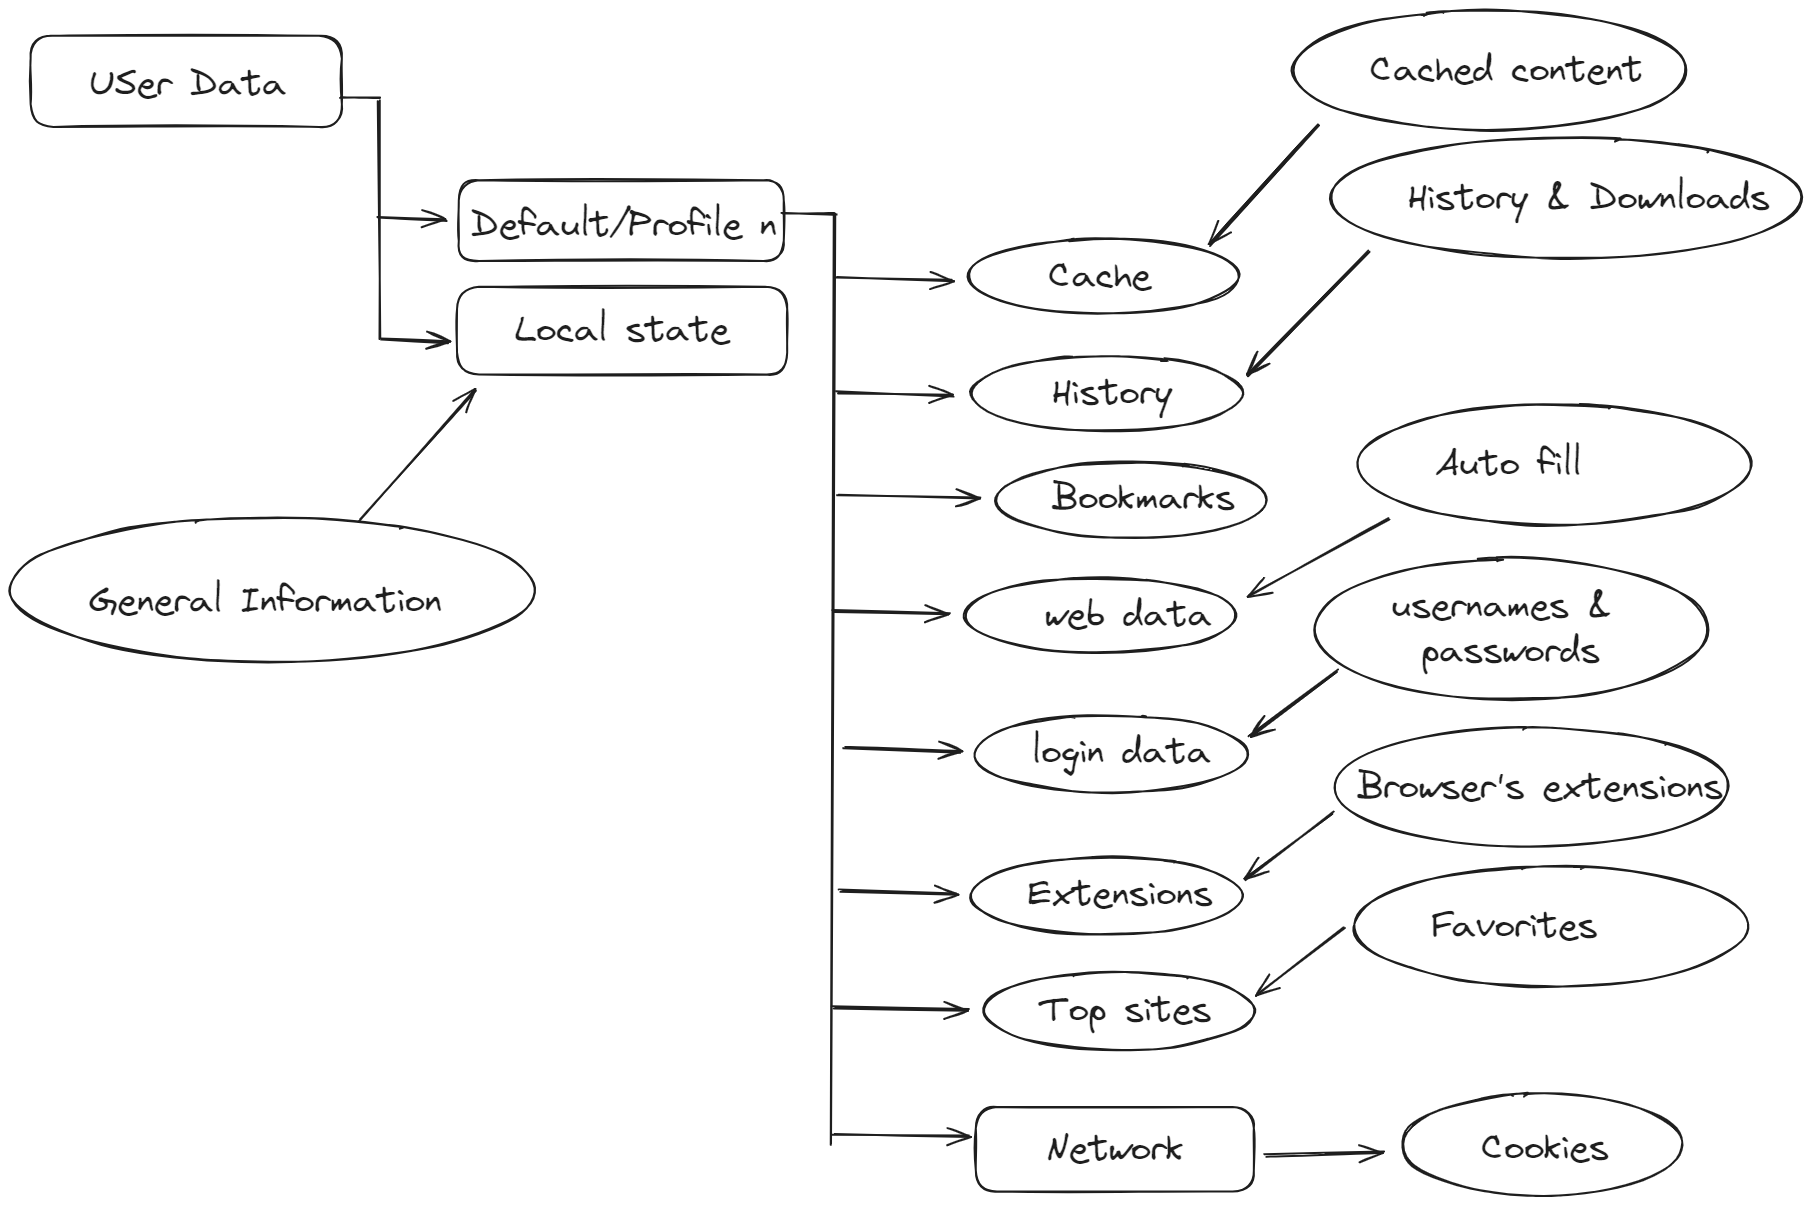
local state
localstate is a JSON file stored with no extension on the “Chrome” folder and contains some important forensic artifacts about the environment, so let’s see some of them and it’s left to you and your case to determine how much is that useful.
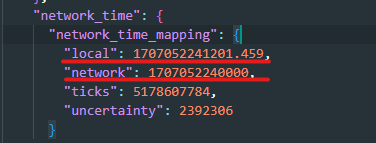
here we can see stored the local time of the machine and the network time, this can be very good if you want to check any deviation of the machine time and can be useful for the whole investigation.
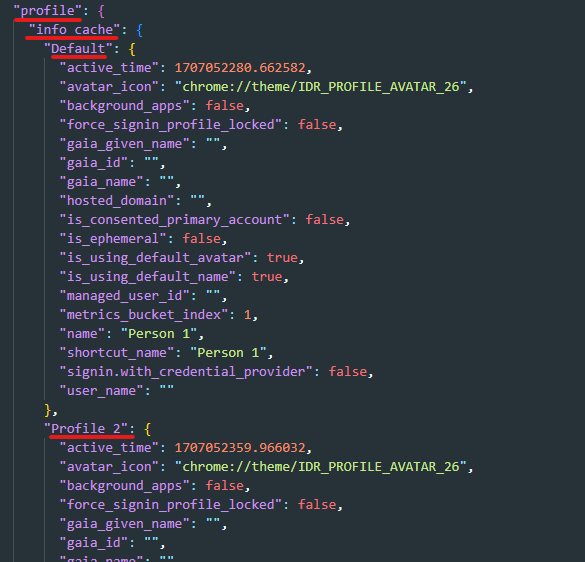
Under profile, we can find a list of all profiles available on the browser and information about each one.
profiles are used on Chrome to separate the user experience for every person if multiple users are using the same browser.the most important property is active_time which stores the last time the user used the browser.
also, there is a separate entry for the last profile used on the browser.
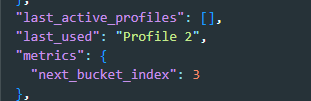
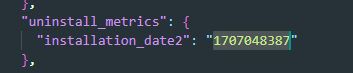
we can also get the installation time of the browser from there.
History
Now we are going to investigate “Default” profile to dig into more evidence traced for every user, starting here with History
“History” is an SQLite database stored on the root of any profile folder without extension.
we can use a tool like “DB Browser” to view SQLite databases.
This artifact stores information about each link visited like the title, visit date, visit count, referrer, and visit duration also stores information about any downloaded content and the download URL.
let’s take a look at important tables there.
Downloads
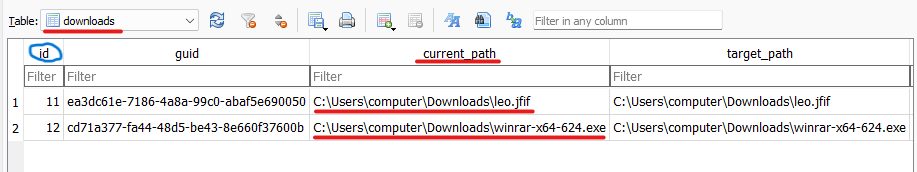
In downloads table we can see the downloaded content and where it has been downloaded.
Note: “id” field is used to link multiple tables together.
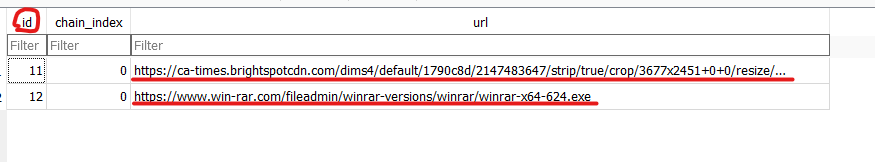
another table related to downloading artifacts is downloads_url_chains which is used to link a downloaded file with the download link.
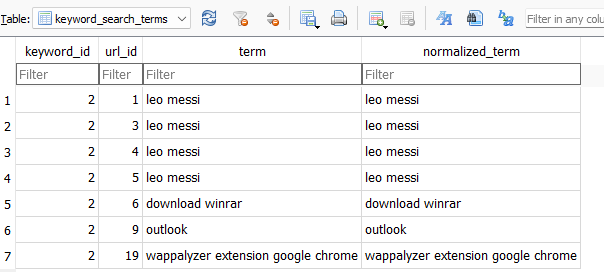
Search
We can view all the text entered to the search engines on the table called Keyword_search_terms
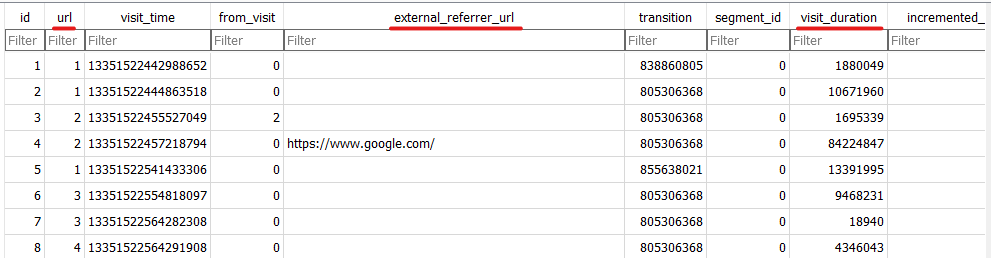
Visits
Another important table is the urls table which stores all the links visited and metadata about them.
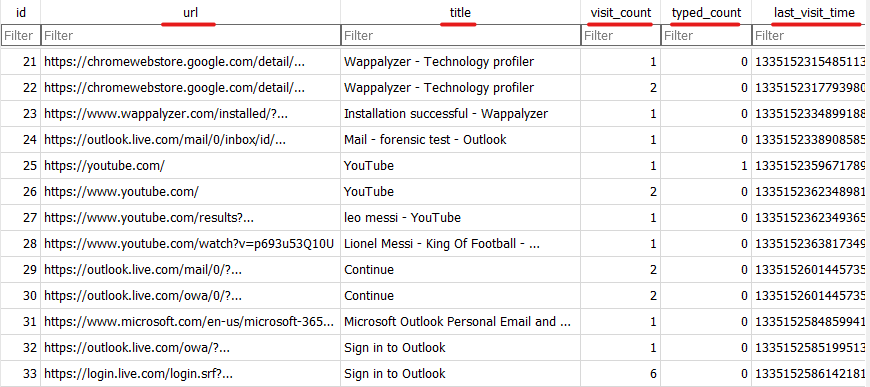
url: the URL visited.title: the title of the page.visit_count: how many times did this url visited.typed_count: how many times did this URL typed by hand not visited through link.last_visit_time: the last time this URL visited.
we can correlate the id from urls table with the URL in visits table to get the duration time of the visit and the external referrer.
Also, a related database called Top Sites which stores a list of the most used sites.
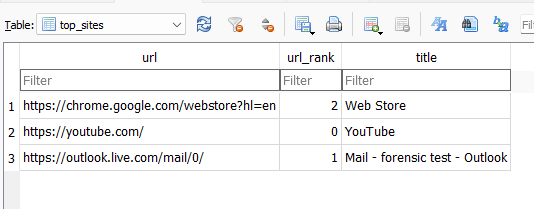
this is the one shown in quick access in new tabs.
Cache
Caching is a feature that was introduced on browsers to make the browsing experience faster by making a local copy of the data on the machine.
we can use a tool called ChromeCacheView to analyze cached content which is stored in Cache_Data folder inside the folder called “Cache”.
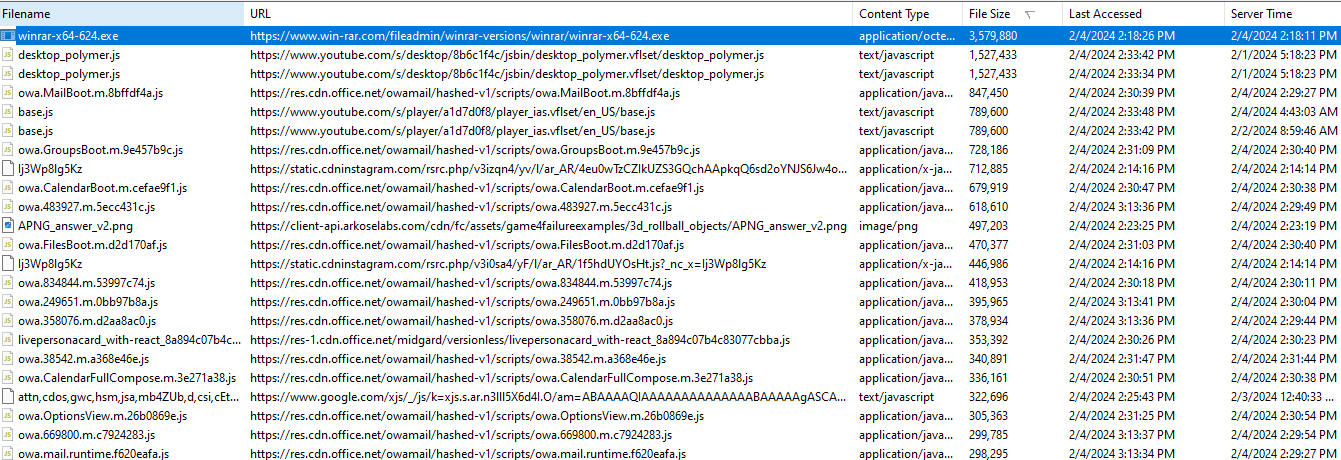
from there, we can find a cached version of all the scripts, photos, files,…etc that were transferred from the servers to our machine.
for each entry we can find multiple valuable information:
- filename
- file content
- URL
- size
- time of last access
- server IP
Login Data
Login Data is an SQLite database where we can see what credentials are stored in the browser.
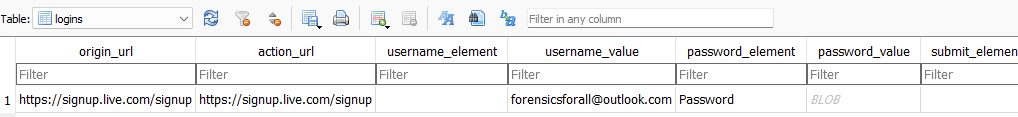
the most important table is logins table there we can find a lot of valuable information for every entry.
original_url: here we can find the site that created the entry.username_value: the user name part of the credentials.date_created: time when these credentials are first stored on the browser.times_used: how many times these saved credentials are used.date_last_used: the last time these credentials were used.
Another related database is Web Data which stores a lot of saved and autofilled content.
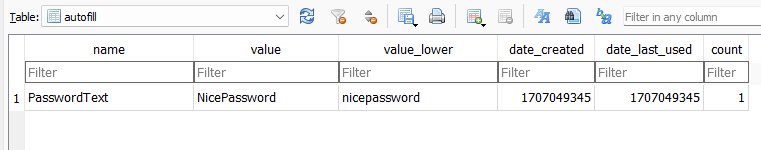
here we can see the clear text password for the saved email account we saw before on the autofil table.
Cookies
Cookies are stored also in a database inside a folder called “Network” where we can find all cookies stored by any site used.
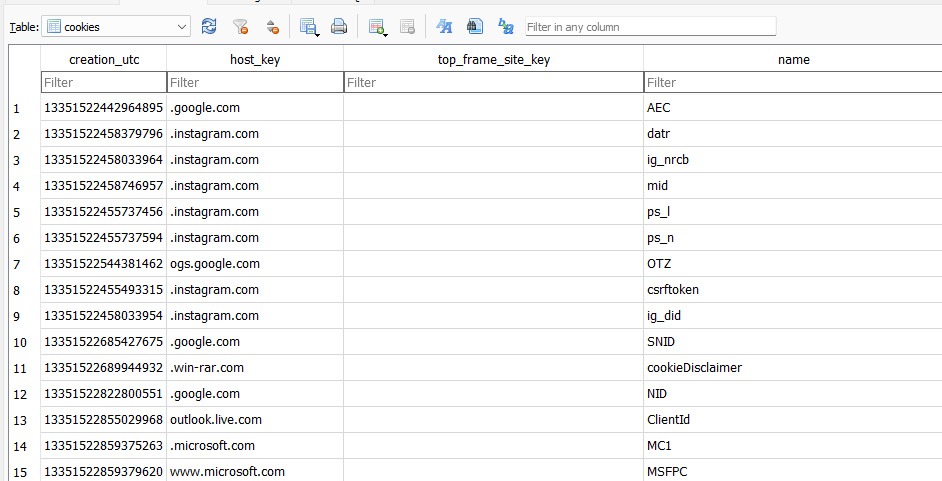
there we can find interesting evidence of visiting any site if it’s deleted from other places like history.
from there we can find:
- Creation time.
- Name
- last access
which can help in creating a timeline for when a user visited a specific site.
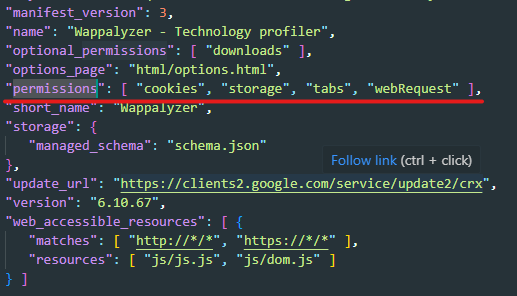
Extensions
Extension is also a big attack vector for browsers as they can do a lot like:
- Data Theft and Exfiltration
- Browser Hijacking
- Credential Theft
- Phishing Attacks
- Unwanted Adware
- Propagation of Malware
We can find installed extensions in the folder called Extensions where each extension has its own folder.
Investigating extension for malicious activity is out of this blog post’s scope but we can do two actions to get a general overview.
-
we can upload the extension for scanning on sites like “virus total”
-
look at the permissions that the extension requests and make sense of it, we can find the permissions on a JSON file called
manifest.json.
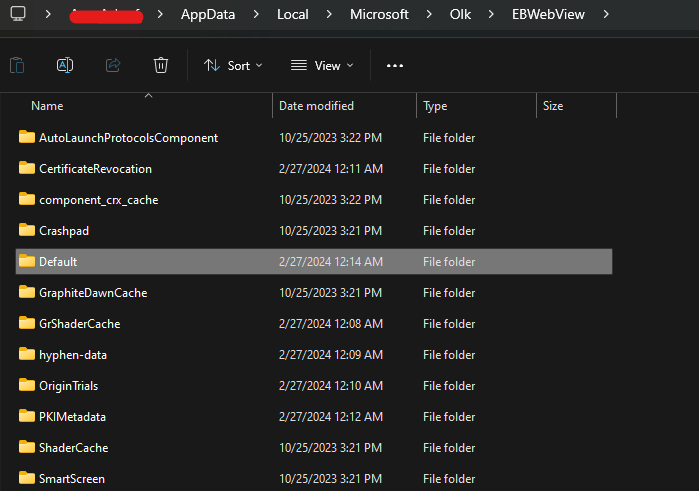
Windows Mail App
Windows has a built-in mail client known as Windows Mail, from a forensics perspective Windows Mail differs from Outlook in the way of how the evidences are stored.
All that we discussed during the blog post is applied to “Windows Mail” as it’s a web application built on top of “Chromium” base.
You can find the artifacts folder for Windows Mail in the following path.
C:\Users\<username>\AppData\Local\Microsoft\Olk\EBWebView
Summary
Browsers are very rich with artifacts that can help the analyst reach his objectives from the investigation as browsers are used everywhere and store a trace of almost every action the user takes while browsing, so we created this blog post to help you understand what can you get out of this road.
References
Author: Amr Ashraf