

Windows Memory Forensics
How to hunt for anomalies in a Windows Memory Dump


At times, following a system compromise, it becomes crucial to retrieve forensically significant data. RAM, being volatile, has a transient nature. With each system reboot, the memory in RAM is cleared. Consequently, if a computer is breached and subsequently restarted, substantial information detailing the sequence of events leading to the system compromise may be lost.
Today we will show in practice how to detect process injection via memory forensics.
First of all, let’s say we have a malware sample. For simulating process injection, just execute notepad.exe and run it in the victim’s machine (Windows 7 x64 VM in my case):
.\hack.exe <notepad.exe PID>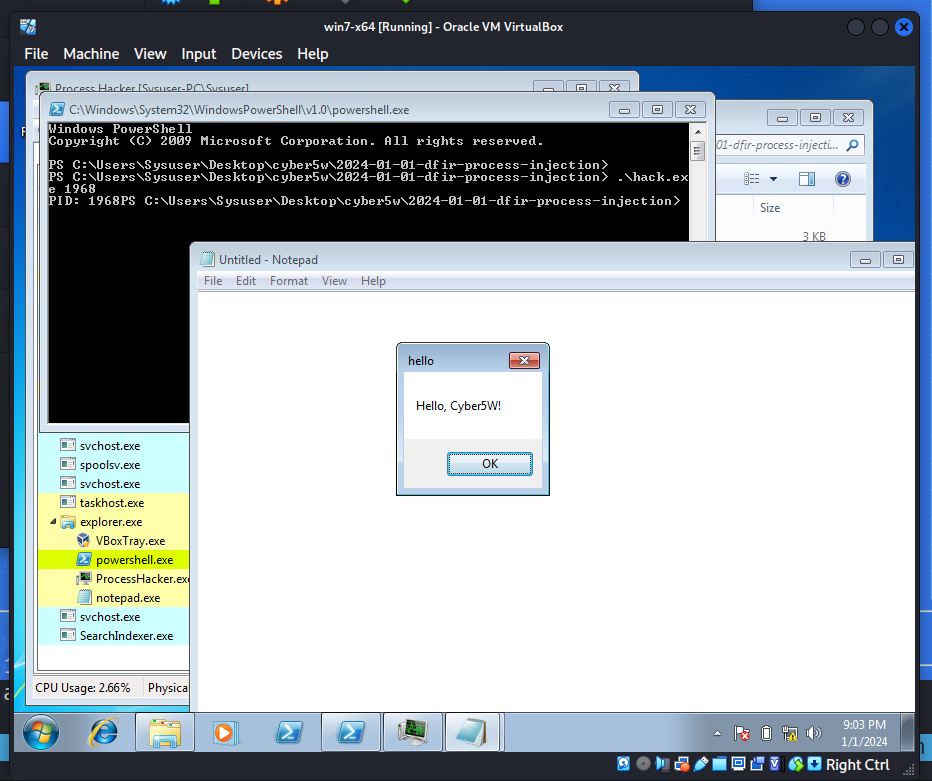
As you can see, everything is work perfectly. Shellcode successfully injected.
Additionally, following the execution of our malicious operation, we proceeded to download winpmem onto the targeted Windows 7 x64 machine. Subsequently, execute:
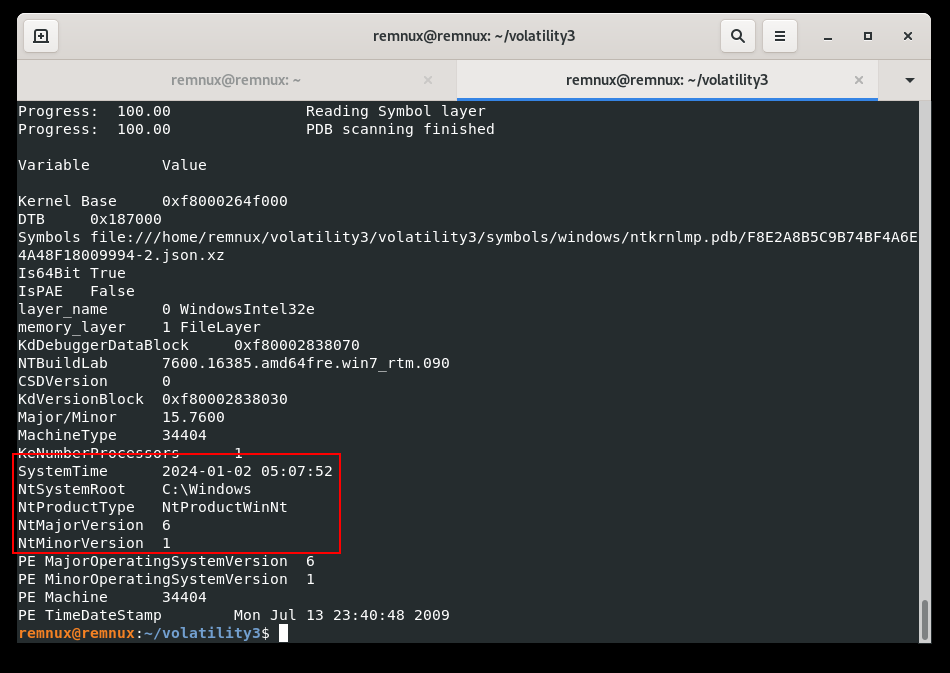
>.\winpmem_v3.3.rc3.exe --output mem.rawFor analysing memory image we use Volatility3 framework. First of all obtaining the OS. Acquiring details about the operating system from the memory dump is a straightforward process. You can utilize the windows.info.Info plugin to retrieve information about the captured memory dump:
python3 ./volatility3/vol.py -f ./mem.raw windows.info.Info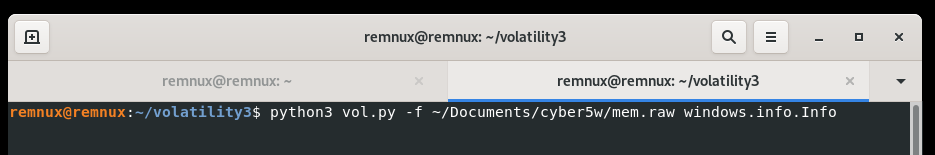
Following that, the windows.pslist.PsList plugin had been used to examine the processes that were active on the compromised computer during the memory capture:
python3 ./volatility3/vol.py -f ./mem.raw windows.pslist.PsList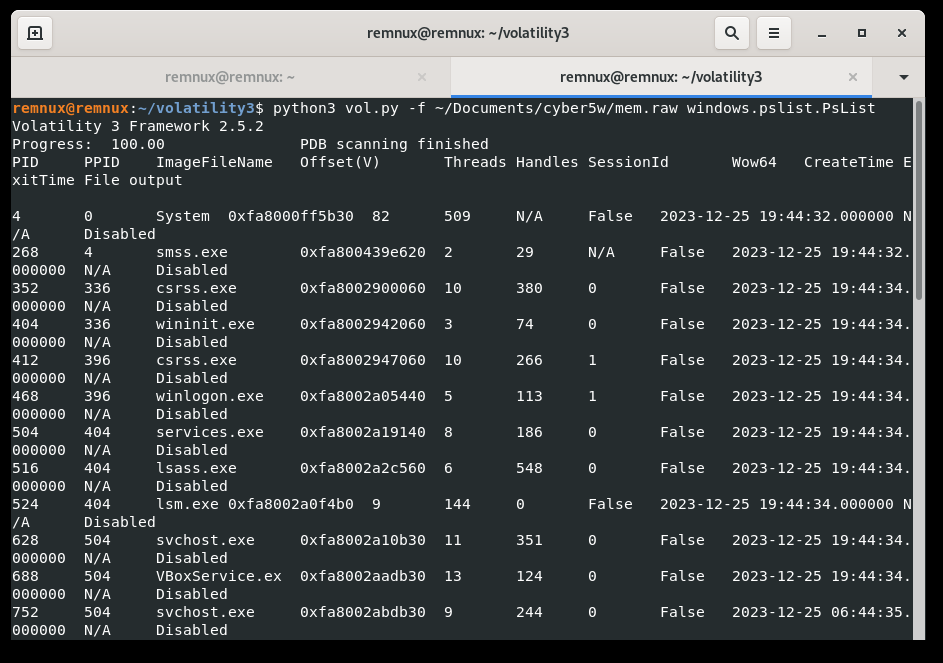
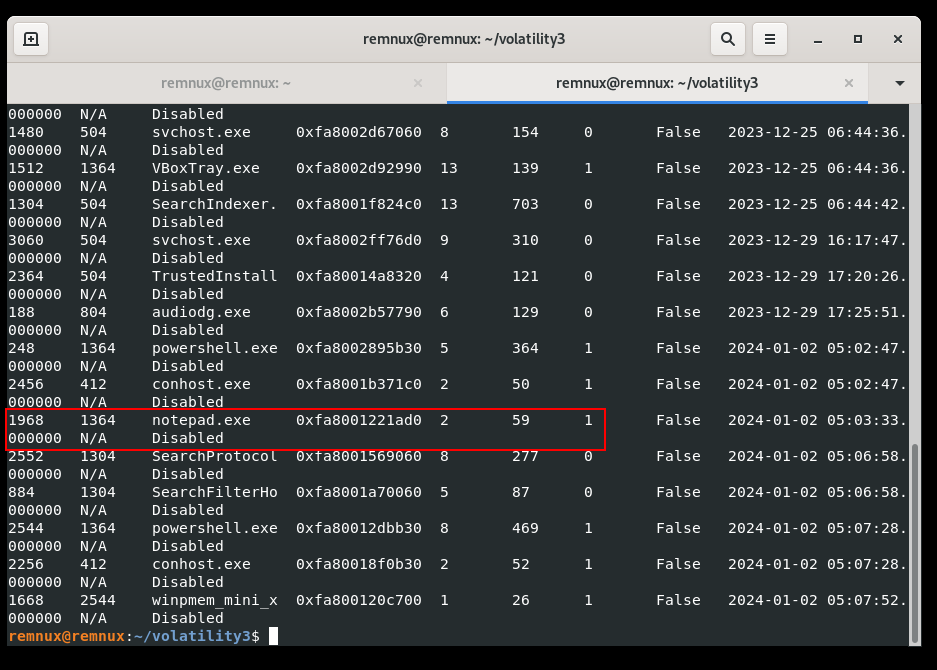
Looking at the list, PID 1363 is notepad.exe, which is our victim process. Let’s go to find injected code to this process. For finding hidden and injected code, just run:
python3 ./volatility3/vol.py -f ./mem.raw windows.malfind.Malfind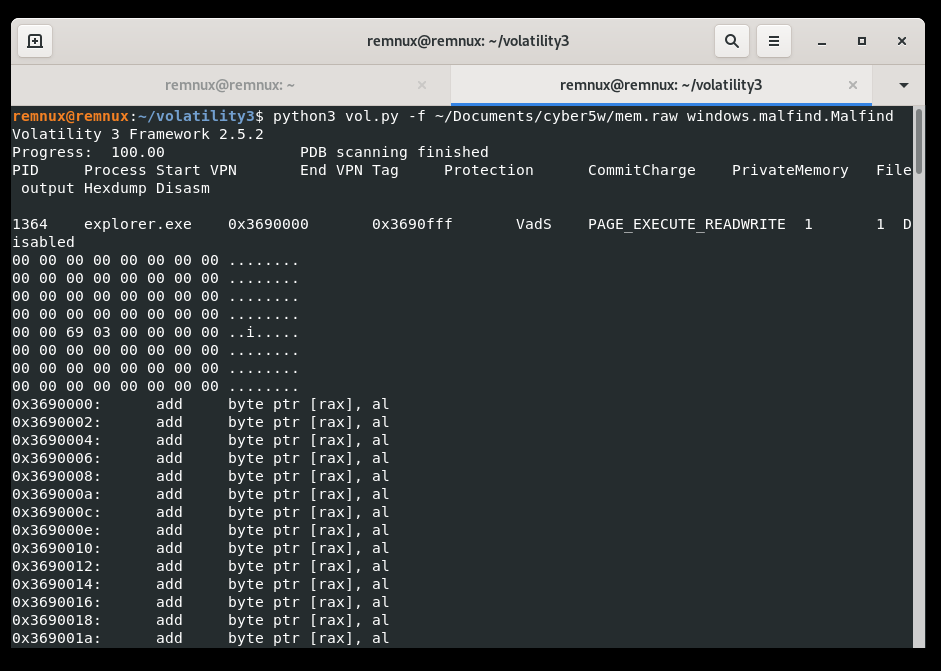
The output contains a list of processes that Volatility suspects may contain injected code based on the permissions, header information displayed in hex, and some extracted assembly code. However, it should be noted that a process’s inclusion in the list does not necessarily indicate that it is entirely malicious or the target process for injection.
What do we see here? We see that several memory areas of different processes have the PAGE_EXECUTE_READWRITE property, which mean it’s executable and readable.
Note that, certain detection tools and antivirus engines have the capability to identify this memory area due to its unusual nature. It becomes conspicuous as the process requires memory that possesses simultaneous attributes of being readable, writable, and executable.
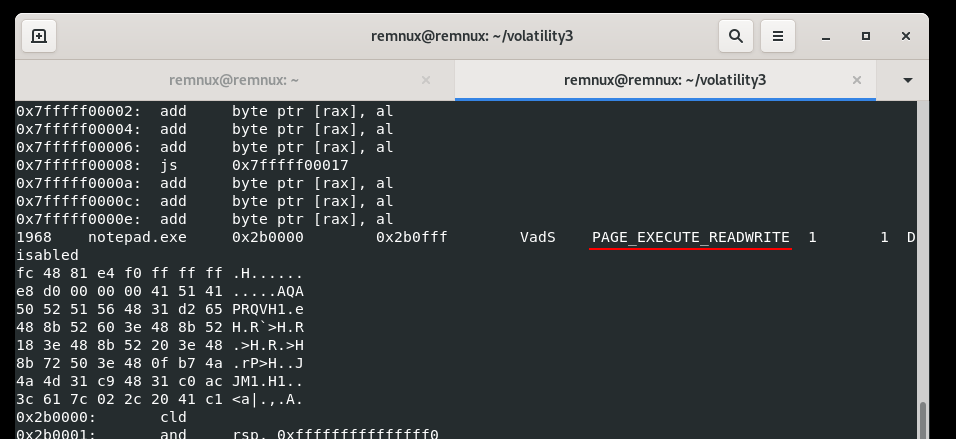
It’s a popular trick of malware authors when use process injection technique:
//allocate memory buffer for remote process
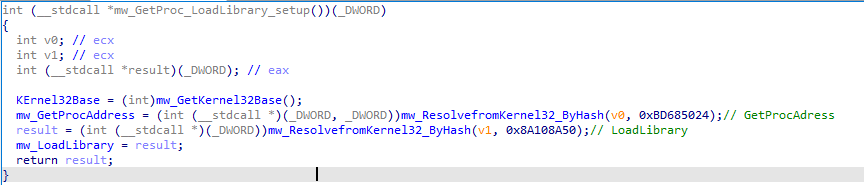
remoteBuffer = VirtualAllocEx(processHandle, NULL, payloadSize, (MEM_RESERVE | MEM_COMMIT), PAGE_EXECUTE_READWRITE);Let’s look at the notepad.exe process. The provided memory block shows a suspicious and potentially malicious code snippet. Why?
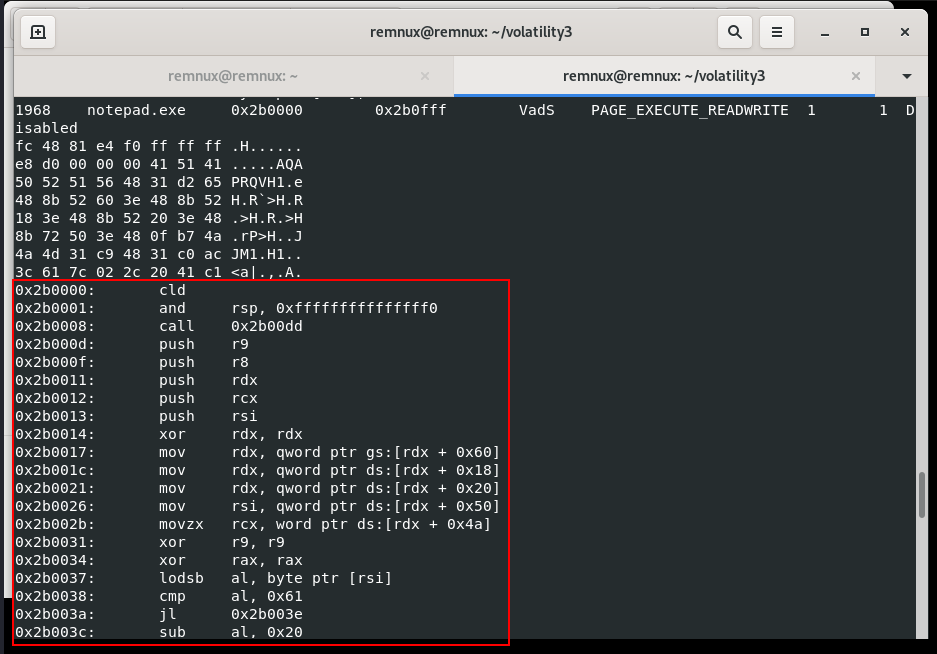
First of all, the code appears to be position-independent, as evident from the relative jumps (jmp) and calls (call). This is a common characteristic of injected or shellcode-like structures. Also, the code modifies the stack pointer (rsp) to align it to a 16-byte boundary. A series of register pushes (push) suggests the preservation of certain register values before making function calls.
Looks like the following assembly instructions involve system calls, accessing the Process Environment Block (PEB), and manipulating thread information:
0x2b0017:	mov	rdx, qword ptr gs:[rdx + 0x60]
0x2b001c:	mov	rdx, qword ptr ds:[rdx + 0x18]
0x2b0021:	mov	rdx, qword ptr ds:[rdx + 0x20]
0x2b0026:	mov	rsi, qword ptr ds:[rdx + 0x50]
0x2b002b:	movzx	rcx, word ptr ds:[rdx + 0x4a]
Let’s break down what these instructions are doing:
mov rdx, qword ptr gs:[rdx + 0x60] - This instruction is accessing the Thread Information Block (TIB) by reading the gs segment register and obtaining the offset to the PEB, which is located at 0x60 in the TIB.
mov rdx, qword ptr ds:[rdx + 0x18] - Here, the code is accessing the PEB to retrieve the process parameters, and the offset 0x18 points to the ProcessParameters field within the PEB.
mov rdx, qword ptr ds:[rdx + 0x20] - Similar to the previous instruction, this is accessing the PEB to retrieve the ActiveProcessLinks field, which is used to navigate the doubly linked list of processes.
mov rsi, qword ptr ds:[rdx + 0x50] - This instruction is extracting the ImageBaseAddress from the PEB, which represents the base address of the image of the current process.
movzx rcx, word ptr ds:[rdx + 0x4a] - Here, the code is reading a word (16 bits) from the PEB, specifically the ImageSubsystem field, which indicates the subsystem the executable is intended to run on.
These instructions collectively involve accessing the PEB, manipulating thread information, and are indicative of interactions with the Windows kernel to gather information about the process and its environment.
Also another indicator is that conditional jumps (jl) based on the comparison results suggest that the code flow is influenced by the content of the memory being processed.
Dynamic memory access is evident through the use of registers (rdx, rsi) to traverse data structures and retrieve information.
The final indicator is fc 48 81 this is msfvenom shellcode bytes:
As you can see, we found memory section where hack.exe injected payload fc 48 81.... to notepad.exe.
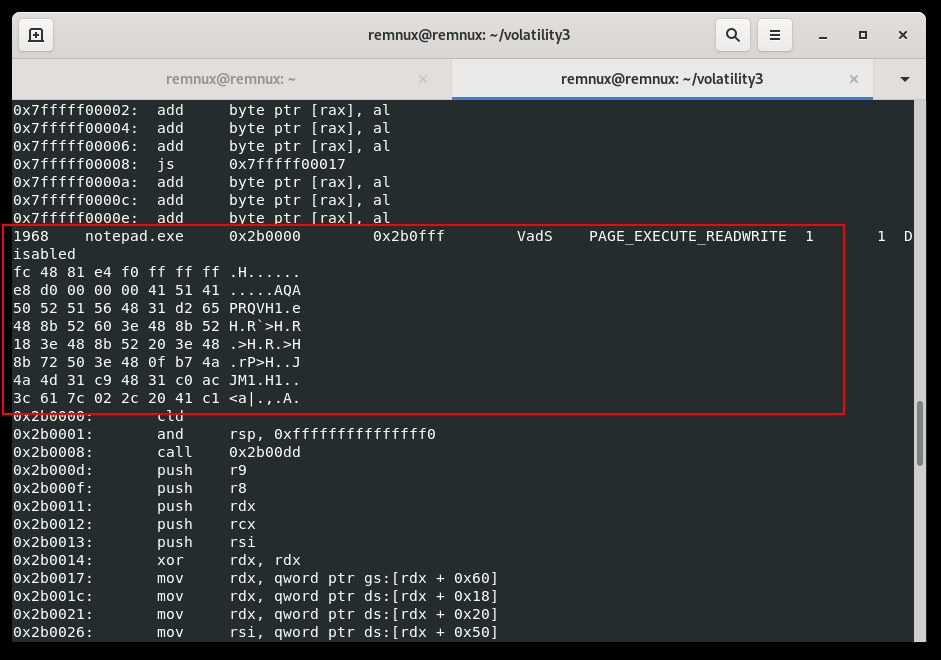
The bytes provided, fc 48 83 e4 f0, represent the beginning of x86-64 shellcode generated by the Metasploit Framework’s msfvenom tool. Let’s break down what each of these bytes represents:
fc - This is the x86-64 instruction for CLD (Clear Direction Flag). It clears the direction flag, indicating that string operations (like REP MOVSB) should move from lower addresses to higher addresses.
48- This byte is part of the REX prefix, which is used in x86-64 instructions to extend the functionality of certain instructions. In this context, it’s often used as a prefix for 64-bit operand size.
83 - This is the opcode for the ADD instruction.
e4 - This is the ModR/M byte for the ADD instruction. The specific operand is determined by the addressing mode encoded in this byte.
f0 - This byte is part of the x86-64 instruction sequence. It is often used as a prefix for LOCK-prefixed instructions.
The presence of shellcode-like characteristics, manipulation of system structures, and dynamic memory access raise suspicions about the code’s intent.
Ok, dump the process memory with windows.memmap.Memmap plugin:
python3 ./volatility3/vol.py -f ./mem.raw --output-dir ./dump/ windows.memmap.Memmap --pid 1968 --dump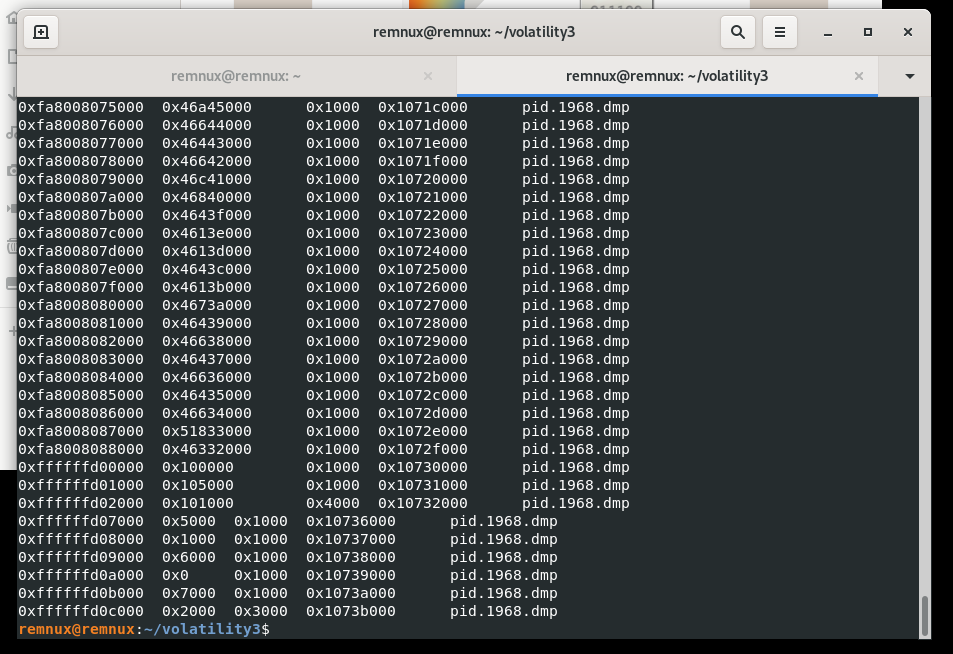
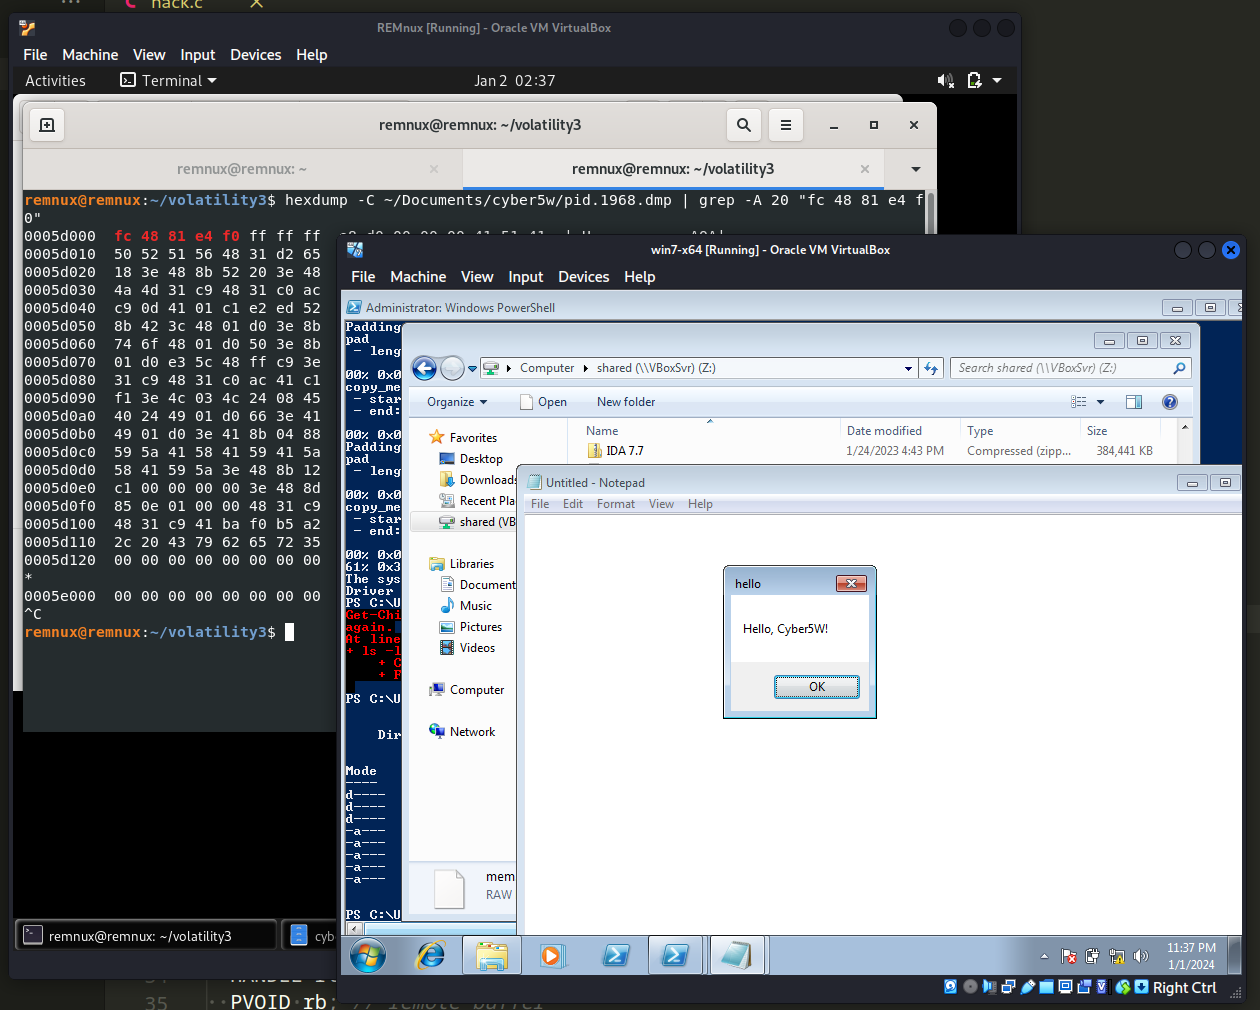
Finally, if we search our bytes fc 48 81 e4:
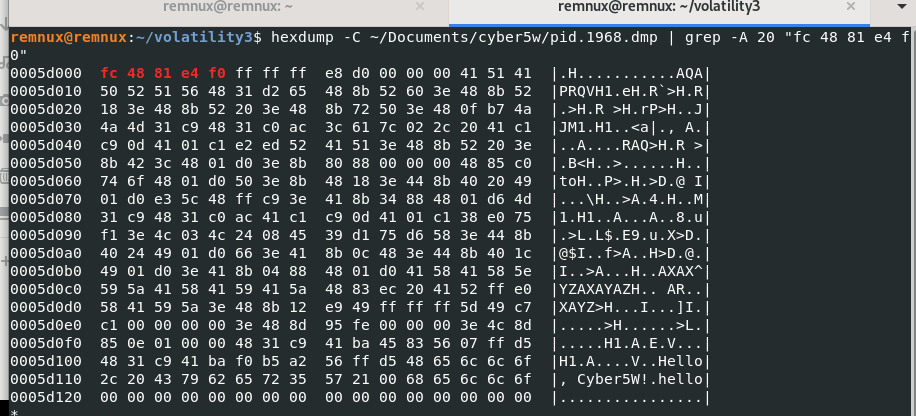
we found our payload bytes.
We hope this post spreads awareness to the blue teamers of this interesting and useful tools, and can be good start for Digital Forensics path. Of course, also this post is useful for entry level cybersec specialists.
https://github.com/volatilityfoundation/volatility3
https://github.com/Velocidex/WinPmem
Cyber5W Intro to forensics
Author: Zhassulan Zhussupov


How to hunt for anomalies in a Windows Memory Dump