Memory Forensics - Practical Example, Detect Classic Remote Process Injection
Practical Example, Detect Classic Remote Process Injection


In this blog post, we are talking about what we can do if we are presented with a Memory image for a suspected machine to investigate and how to leverage our tools to get as much information as we can from it.
we will be dealing with two tools:
Experience Level required: Beginner
Memory forensics is a must-have skill for any computer forensics investigator, you can find a lot of evidence that can’t be found on the disk like:
dealing with memory images from scratch can be really challenging as this will require a strong understanding of the memory layout and data structures for the operating system being investigated, but fortunately, there are tools that can do that work of parsing these data structures for us and give us the final result we asked for, so we can focus on the important part which is what actually we want to see and how to reach our objective from the analysis.
One of the most important tools in memory forensics is “Volatility” which is a plugin-based Python tool where you have different plugins each one can extract specific information from memory.
during this blog post, we will be dealing with “volatility3”.
You can find the practice material we are working on, in the “Material” section at the end.
In volatility2 you are required to use a specific profile when dealing with memory images but in volatility3 the plugins themselves are dynamically identifying the profile.
when using volatility you need to supply the following arguments:
python3 vol.py -f <MemoryImage> <Plugin>Let us start with a simple plugin that shows some info about the machine.
python3 .\vol.py -f D:\MemoryDump.mem windows.info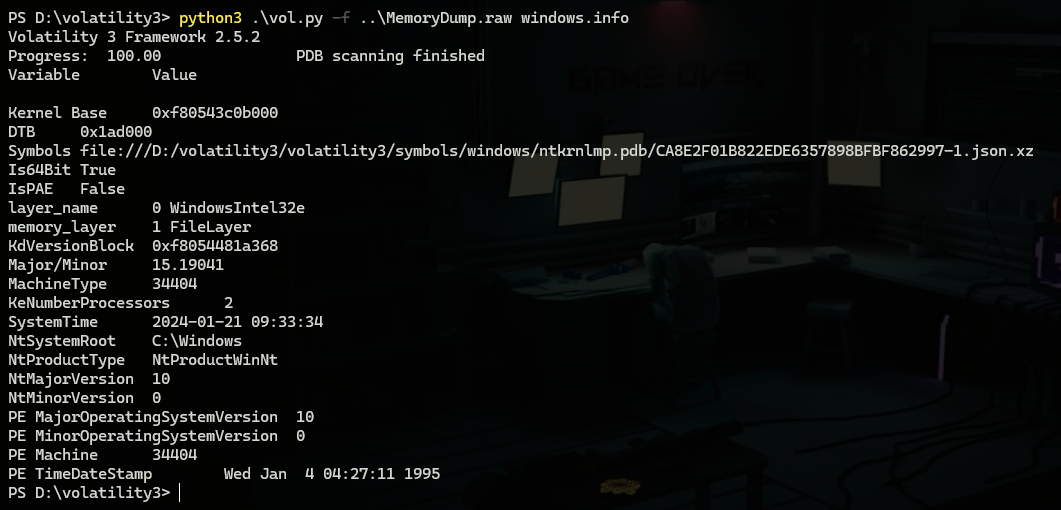
This can tell us about what Windows version we are dealing with “Windows 10” and System time which is the time when the memory capture is taken.
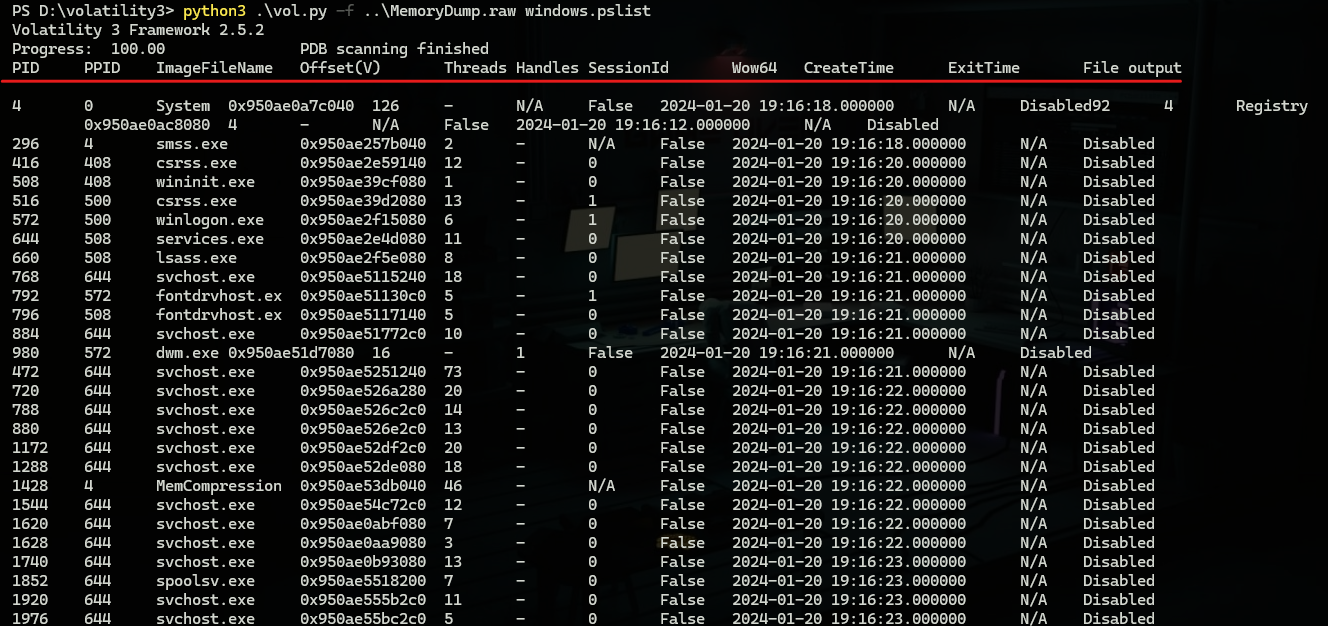
Memory image contains all the information about the machine which includes what processes were running when the image was captured, and to investigate that there are multiple plugins to deal with running processes.
the first one is windows.pslist plugin which is used to just list running processes with the info shown in the following image.
windows.psscan is almost the same as “windows.pslist” but it can sometimes get terminated processes and when they are terminated also it’s using different method to find running processes which will be good to use if the attacker uses an anti-forensics technique to hide his malicious process.
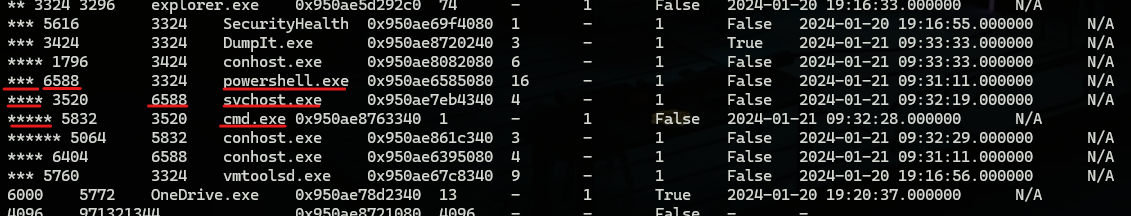
windows.pstree which is the most used as it can view processes in a tree form where you can see the parent-child relationship between processes.
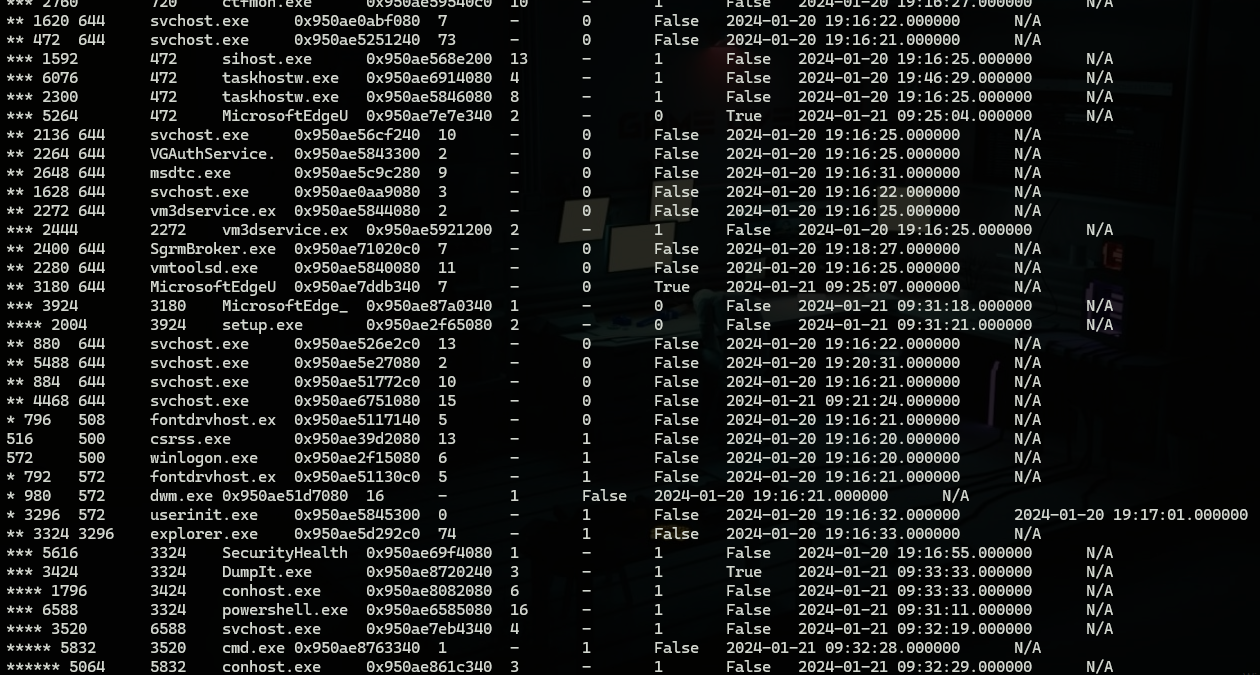
To continue our investigation there is a malicious activity happening on the machine and we will go through its investigation to see what we can get from a memory of a compromised machine.
from “windows.pstree” output we can spot a “svchost” process running as a child to “powershell” and a child for it “cmd” this seems suspicious for many reasons but the most suspicious one is that “svchost” can only have parent process “services.exe’ which mean this is something worth looking for so we will keep digging.
once we have a suspicious process we can move further and use other plugins to investigate further.
windows.cmdline which is used to view the command line that executed any process which can have the process id you want to investigate as a parameter.
Note: you can get all parameters of a specific plugin by using “-h” after the plugin name.
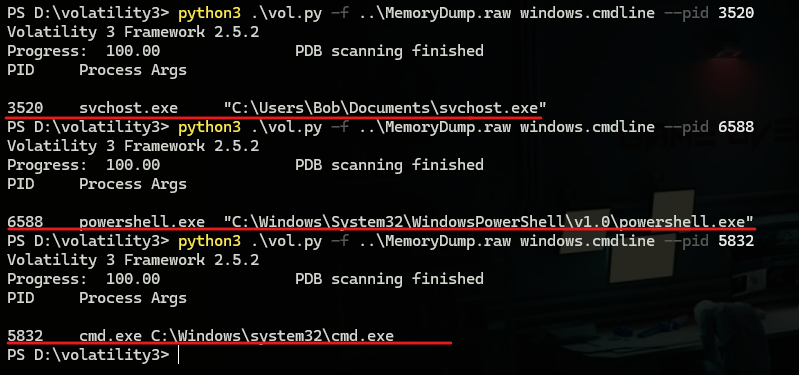
Here we can see from the command line of “svchost” that it’s running from “Documents” directory.
In some cases you may find results from volatility saying that information is swapped, Swapping is a mechanism used to use memory efficiently by moving unused content from memory to disk and getting it back once needed.
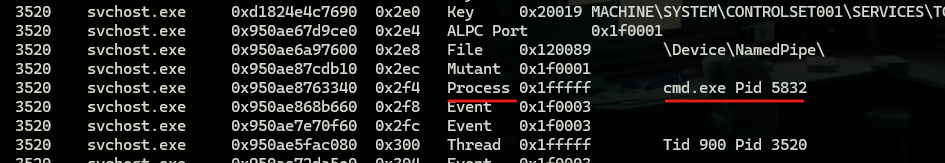
also, we can use windows.handles to get what handles our process referenced which can be helpful to find access to files or creating of a process.
also, another command that can be very useful when dealing with DLLs through injection or any other attack type that includes using DLL which is windows.dlllist which is used to display DLLs loaded on the process.
After knowing that a process is worth more investigation we can use windows.dumpfiles.DumpFiles plugin with the pid of the target process to extract it for further analysis.
A great benefit of having a memory image of a suspected machine is that we can get a live feed of what IPs this machine is connecting and also what is the process that created that connection.
windows.netscan is used to do that.
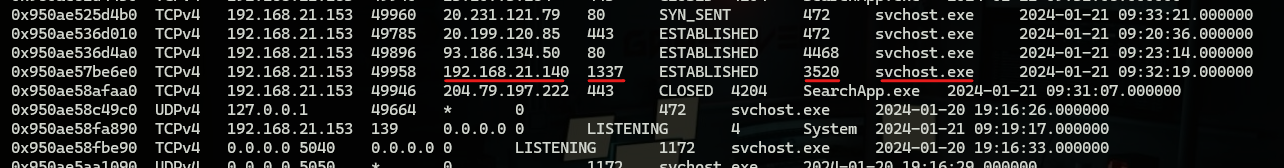
when looking at the output we can see the suspicious process reaching out to “192.168.21.140” on port “1337”
Some plugins also have some rules to help you automatically spot anomalies, this may have some false positives but it can really reduce the amount of data you are required to look for.
windows.malfind is used more often for that.
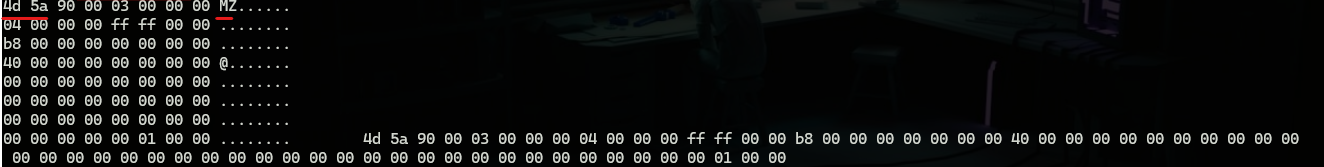
a technique that this plugin is using which is looking for memory pages with “Read & Write & execute” permissions, although this can be used in legitimate processes but it’s extensively used in malicious binaries, especially if the first bytes at that memory page are MZ which is the signature for windows executables.
This is not applicable in our testing case but it can look like this.
Volatility is not limited to what we talked about as you can look at the tool help and find more and more functionalities implemented in different plugins, but here I want to introduce another tool that is built on top of volatility plugins.
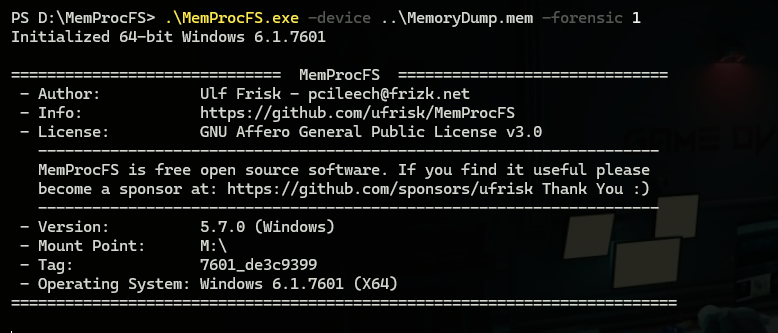
MemProcFS is used to view the output of multiple volatility plugins at once in a file system view.
using the tool is really easy you just need to pass the memory image and a parameter called “forensic” which tells the tool to do an automatic forensic analysis of the image.
Note: forensic results can take some time after mounting the image to be completed.
when going to the mounted point we can find the following files.
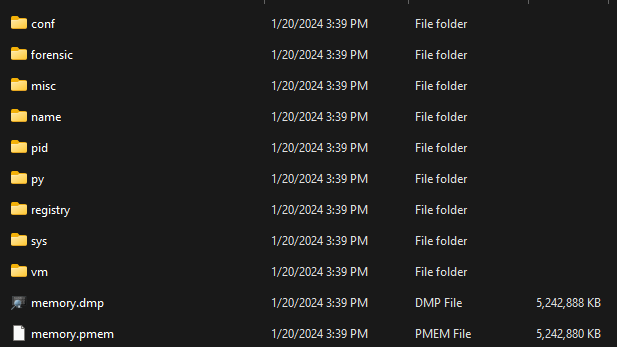
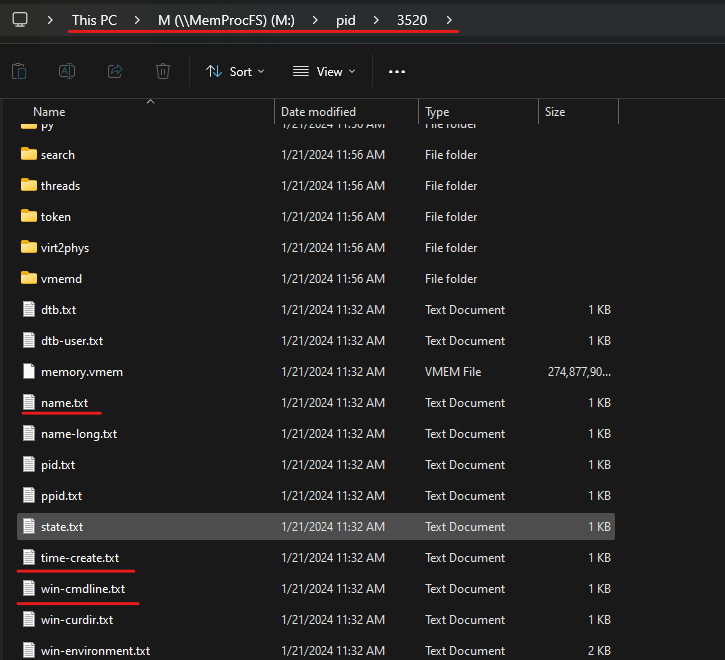
we can find information about running processes grouped by “name” or “pid” and inside each process directory, we can find a lot of information like the ones we got before from volatility and others.
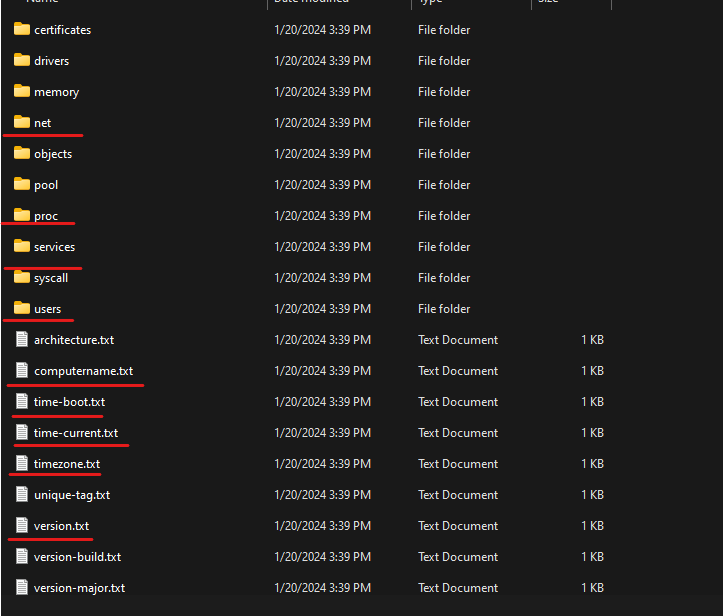
we also can find a lot of information about the system inside “sys” directory like network, users, OS info, and others.
What can be the most important one is “Forensic” folder which contains a lot of forensic information.
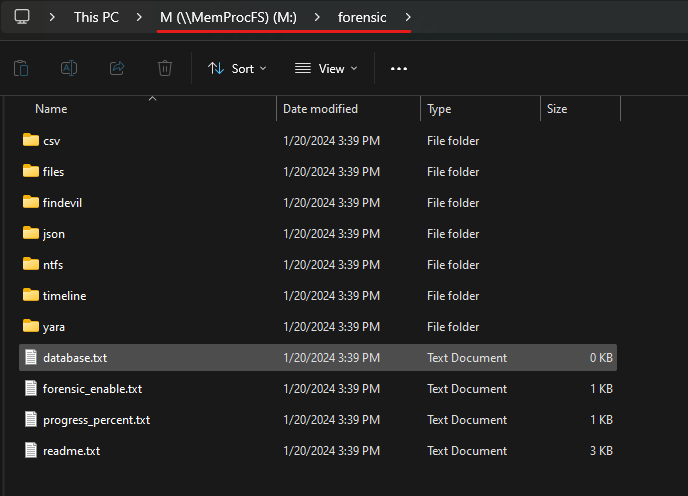
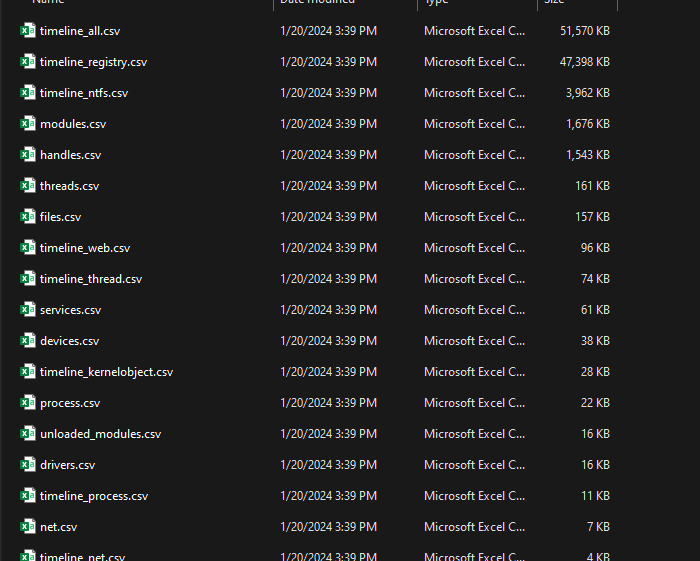
there we can find timelines created for a lot of artifacts like NTFS, network, web, processes, and others.
also, there is “findevil” folder where you can find anomalies found by the tool.
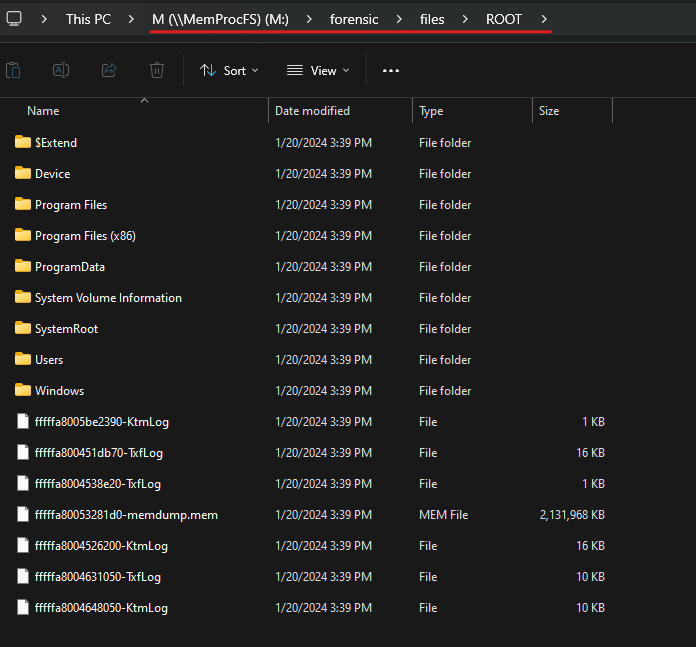
also, the folder called “files” which will have the content of the disk presented in the memory which you can use if you don’t have a Disk image.
From there we can’t tell all possible things that you can do as everything applied to disk analysis like registry analysis or logs analysis or anything from this large list can be done.
Every investigation has its objectives and your way deep inside the evidence files differs from case to case but once you know how to use your plugins to get what you want then you are fine, here we mentioned some important plugins that you will find yourself using in almost every memory forensic investigation like looking for suspicious parent-child relationships, network connections, execution command lines, referenced files within an executable, general way to spot anomalies, and how to make the process easier for you by using a modern tool like “MemProcFS”.
The memory dump is splited into three parts.
Author: Amr Ashraf


Practical Example, Detect Classic Remote Process Injection